Posts from September 2015 (45)

September 21, 2015

It’s bad enough without exaggerating

This UK survey report is being a bit loose with the details, in a situation where that’s not even needed

stem for boys

The survey of more than 4,000 girls, young women, parents and teachers, demonstrates clearly that there is a perception that STEM subjects and careers are better suited to male personalities, hobbies and brains. Half (51 percent) of the teachers and 43 percent of the parents surveyed believe this perception helps explain the low uptake of STEM subjects by girls. [emphasis added]

Those aren’t the same thing at all.  I believe this perception helps explain the low uptake of STEM subjects by girls. Michelle ‘Nanogirl’ Dickinson believes this perception helps explain the low uptake of STEM subjects by girls. It’s worrying that nearly more than half of UK teachers don’t believe this perception helps explain the low uptake of STEM subjects by girls.

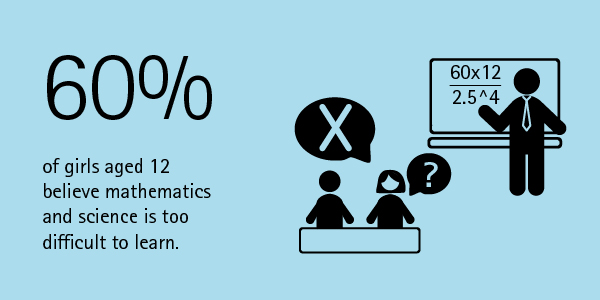
On the other hand, this is depressing and actually does seem to be what the survey said:

Nearly half (47 percent) of the young girls surveyed said they believe such subjects are a better match for boys.

as does this

difficult subjects 
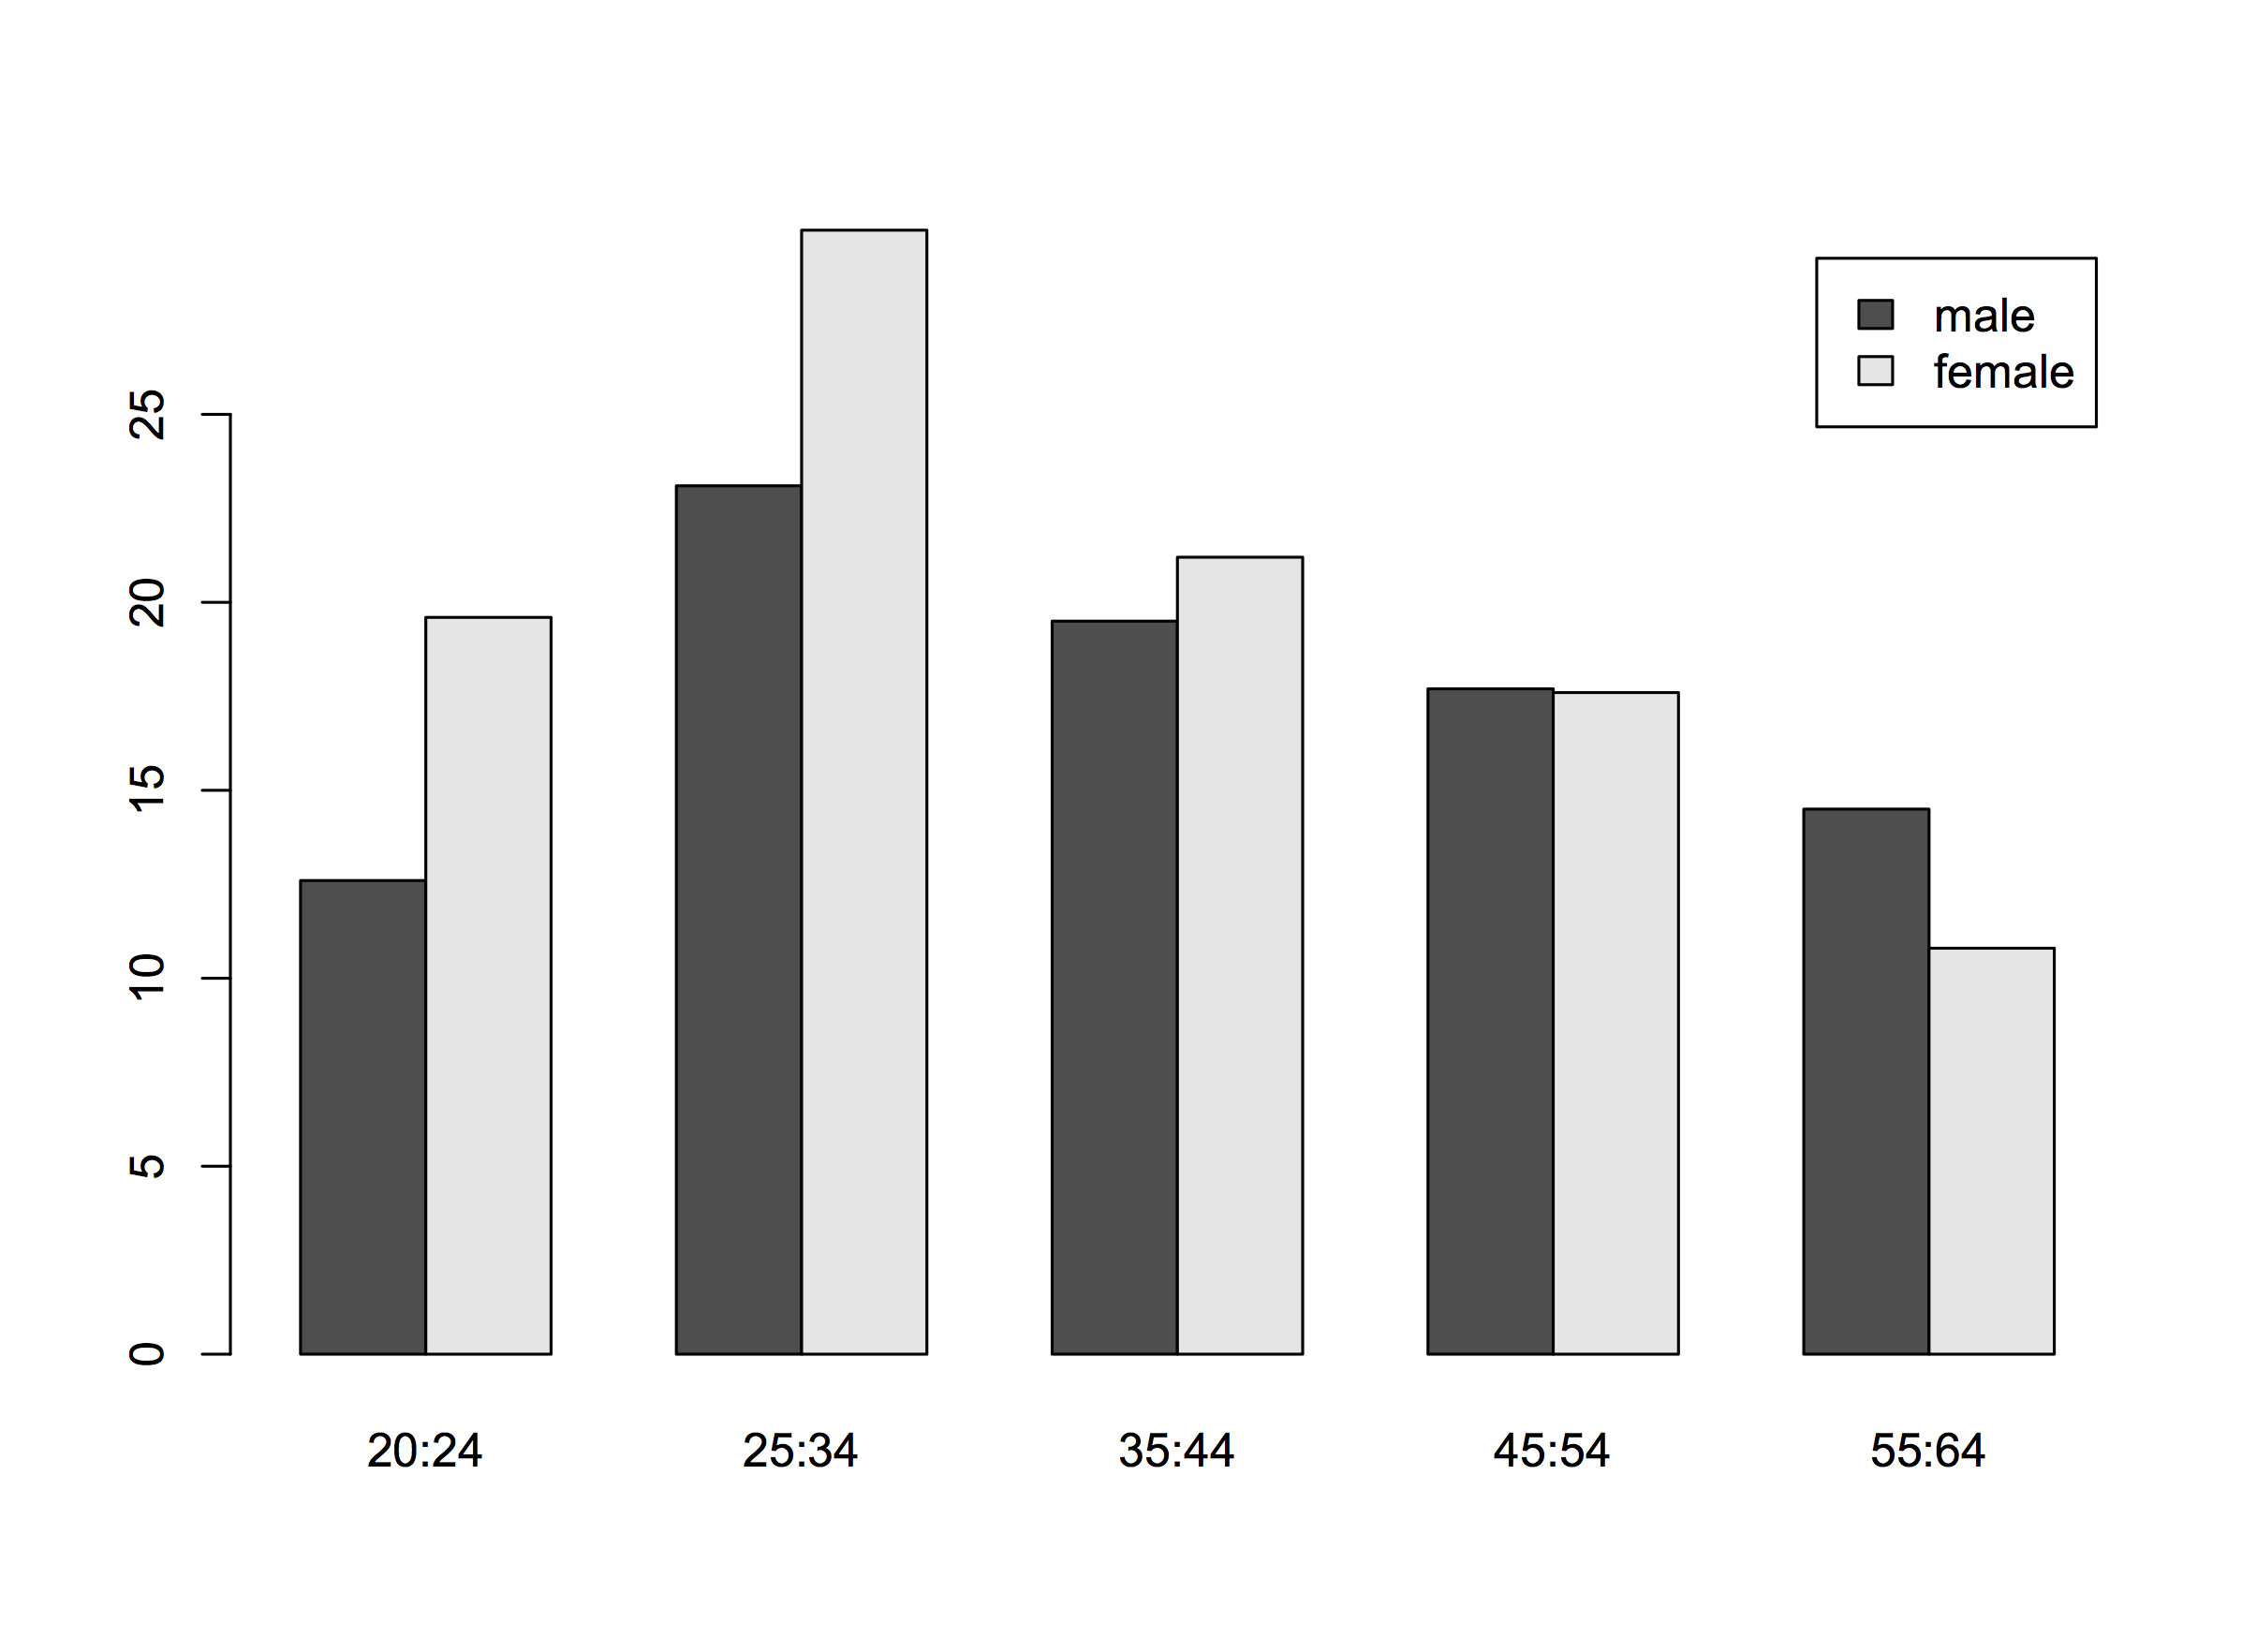
It would fit with NZ experience if a lot of boys felt the same about the difficulty of science and maths, but that wouldn’t actually make it any better.


Stat of the Week Competition: September 19 – 25 2015

Each week, we would like to invite readers of Stats Chat to submit nominations for our Stat of the Week competition and be in with the chance to win an iTunes voucher.

Here’s how it works:

  • Anyone may add a comment on this post to nominate their Stat of the Week candidate before midday Friday September 25 2015.
  • Statistics can be bad, exemplary or fascinating.
  • The statistic must be in the NZ media during the period of September 19 – 25 2015 inclusive.
  • Quote the statistic, when and where it was published and tell us why it should be our Stat of the Week.

Next Monday at midday we’ll announce the winner of this week’s Stat of the Week competition, and start a new one.

(more…)

Stat of the Week Competition Discussion: September 19 – 25 2015

If you’d like to comment on or debate any of this week’s Stat of the Week nominations, please do so below!

September 18, 2015

Compared to what? (transport chaos edition)

A while back, it looked as though the negotiations between NZ Bus and its drivers would break down and we would have bus strikes in Auckland. I considered various contingency plans: working from home for all or part of  a day, taking a train to Newmarket or Britomart and walking to the University, cycling, or catching a ride with a colleague who lives nearby. Some of these were options because we would have a week or so of warning before the strike.

If public transport in Auckland became permanently bad — if it went back to its state 20 years ago — I would have different options. I probably wouldn’t live in a house in Onehunga; I’d live in an apartment near the city centre. Moving to the city centre wouldn’t be a sensible response to a single day’s stoppage, but it would be sensible if the lack of buses was permanent.

Transport Blog has a post about the congestion benefits of the Wellington rail system, based on the week in June 2013 that it was taken out by a storm. On weekdays during this period, about 4000 people who would normally take the train into Wellington couldn’t. The roads became much more congested, and these delays can be valued (using plausible-looking assumptions) as worth over $5 million. Scaling this up to a full working year, the benefit to drivers in reduced driving time is worth rather a lot more than the public subsidy to the entire Wellington public transit system.

There’s a problem with simply scaling up the costs. If the Hutt Valley train line didn’t exist, some of those 4000 people would either live somewhere else or work somewhere else. Driving for an extra two hours each way was a rational response by them to a short-term outage, but in the long term they would reorganise their lives to not do it.

Now, there’s obviously a cost to moving from the Hutt to Wellington for these people — otherwise they’d be living in Wellington already — but the cost is less than would be estimated from the travel time during the outage. It’s hard to tell how much less without a lot more data and modelling.

On the other hand, while the storm data almost certainly overestimate the congestion-cost benefits of the train line, the magnitude of the estimated benefit is so large that the conclusion could quite easily hold even with better estimates.

September 17, 2015

Kids these days

I made this graph for a lecture on longitudinal data, then thought I’d share it. It shows the percentage of New Zealanders with post-secondary qualifications, by age and sex (data from 2006). The proportion with qualifications goes down after age 35.

age-cohort-degree

Obviously NZ universities aren’t taking people’s degrees away (except occasionally), so as individual get older, their qualifications either stay the same or increase. The downward trend is a cohort effect — people born in the 1950s are less likely to end up with post-secondary qualifications than people born in the 1970s.  Ten years earlier, the proportion in the 25-34 age group was 14.7% for men and 13.1% for women, so this cohort of people, now 35-44, do have more qualifications than they did ten years ago.

In this case the explanation is obvious, but often news stories talk about Kids These Days and how they should, eg, Get Off Our Lawns The Internet. After checking that the trend is real (a disturbingly important step) it’s worth asking whether the story’s attribution of the problem to age effects or cohort effects is right.

September 16, 2015

Rugby World Cup Predictions for Week 1

Team Ratings for Week 1

The basic method is described on my Department home page.

Here are the team ratings prior to this week’s games, along with the ratings at the start of the Rugby World Cup.

Current Rating Rating at RWC Start Difference
New Zealand 29.01 29.01 0.00
South Africa 22.73 22.73 0.00
Australia 20.36 20.36 0.00
England 18.51 18.51 0.00
Ireland 17.48 17.48 0.00
Wales 13.93 13.93 -0.00
France 11.70 11.70 0.00
Argentina 7.38 7.38 -0.00
Scotland 4.84 4.84 -0.00
Samoa -2.28 -2.28 0.00
Fiji -4.23 -4.23 -0.00
Italy -5.86 -5.86 0.00
Tonga -6.31 -6.31 0.00
Japan -11.18 -11.18 -0.00
USA -15.97 -15.97 -0.00
Georgia -17.48 -17.48 -0.00
Canada -18.06 -18.06 -0.00
Romania -21.20 -21.20 -0.00
Uruguay -31.04 -31.04 -0.00
Namibia -35.62 -35.62 -0.00


Predictions for Week 1

Here are the predictions for Week 1. The prediction is my estimated expected points difference with a positive margin being a win to the first-named team, and a negative margin a win to the second-named team.

Game Date Winner Prediction
1 England vs. Fiji Sep 18 England 22.70
2 Tonga vs. Georgia Sep 19 Tonga 17.70
3 Ireland vs. Canada Sep 19 Ireland 42.00
4 South Africa vs. Japan Sep 19 South Africa 40.40
5 France vs. Italy Sep 19 France 24.10
6 Samoa vs. USA Sep 20 Samoa 20.20
7 Wales vs. Uruguay Sep 20 Wales 45.00
8 New Zealand vs. Argentina Sep 20 New Zealand 28.10


NRL Predictions for Finals Week 2

Team Ratings for Finals Week 2

The basic method is described on my Department home page.

Here are the team ratings prior to this week’s games, along with the ratings at the start of the season.

Current Rating Rating at Season Start Difference
Roosters 12.20 9.09 3.10
Broncos 8.88 4.03 4.80
Cowboys 7.52 9.52 -2.00
Storm 6.15 4.36 1.80
Bulldogs 2.44 0.21 2.20
Sea Eagles 0.46 2.68 -2.20
Sharks 0.30 -10.76 11.10
Dragons -0.09 -1.74 1.60
Rabbitohs -0.24 13.06 -13.30
Raiders -1.13 -7.09 6.00
Panthers -2.78 3.69 -6.50
Eels -5.07 -7.19 2.10
Wests Tigers -5.16 -13.13 8.00
Knights -5.46 -0.28 -5.20
Warriors -7.47 3.07 -10.50
Titans -9.20 -8.20 -1.00


Performance So Far

So far there have been 196 matches played, 115 of which were correctly predicted, a success rate of 58.7%.
Here are the predictions for last week’s games.

Game Date Score Prediction Correct
1 Roosters vs. Storm Sep 11 18 – 20 10.90 FALSE
2 Bulldogs vs. Dragons Sep 12 11 – 10 6.30 TRUE
3 Broncos vs. Cowboys Sep 12 16 – 12 4.40 TRUE
4 Sharks vs. Rabbitohs Sep 13 28 – 12 1.50 TRUE


Predictions for Finals Week 2

Here are the predictions for Finals Week 2. The prediction is my estimated expected points difference with a positive margin being a win to the home team, and a negative margin a win to the away team.

Game Date Winner Prediction
1 Roosters vs. Bulldogs Sep 18 Roosters 12.80
2 Cowboys vs. Sharks Sep 19 Cowboys 10.20


ITM Cup Predictions for Round 6

Team Ratings for Round 6

The basic method is described on my Department home page.

Here are the team ratings prior to this week’s games, along with the ratings at the start of the season.

Current Rating Rating at Season Start Difference
Canterbury 14.93 10.90 4.00
Tasman 14.34 12.86 1.50
Taranaki 8.00 7.70 0.30
Auckland 5.47 5.14 0.30
Hawke’s Bay 4.91 -0.57 5.50
Wellington 4.89 -4.62 9.50
Counties Manukau -0.43 7.86 -8.30
Otago -3.87 -4.84 1.00
Waikato -4.46 -6.96 2.50
Manawatu -4.50 -1.52 -3.00
Bay of Plenty -9.01 -9.77 0.80
Southland -10.43 -6.01 -4.40
North Harbour -10.97 -10.54 -0.40
Northland -12.86 -3.64 -9.20


Performance So Far

So far there have been 38 matches played, 27 of which were correctly predicted, a success rate of 71.1%.
Here are the predictions for last week’s games.

Game Date Score Prediction Correct
1 Auckland vs. Manawatu Sep 09 45 – 28 16.00 TRUE
2 Waikato vs. Southland Sep 10 30 – 25 11.10 TRUE
3 Wellington vs. Tasman Sep 11 17 – 36 -2.50 TRUE
4 North Harbour vs. Counties Manukau Sep 12 28 – 20 -9.70 FALSE
5 Bay of Plenty vs. Taranaki Sep 12 9 – 32 -10.80 TRUE
6 Canterbury vs. Hawke’s Bay Sep 12 29 – 14 13.80 TRUE
7 Auckland vs. Otago Sep 13 35 – 29 14.90 TRUE
8 Manawatu vs. Northland Sep 13 42 – 17 9.70 TRUE


Predictions for Round 6

Here are the predictions for Round 6. The prediction is my estimated expected points difference with a positive margin being a win to the home team, and a negative margin a win to the away team.

Game Date Winner Prediction
1 Tasman vs. North Harbour Sep 16 Tasman 29.30
2 Wellington vs. Otago Sep 17 Wellington 12.80
3 Taranaki vs. Waikato Sep 18 Taranaki 16.50
4 Hawke’s Bay vs. Bay of Plenty Sep 19 Hawke’s Bay 17.90
5 Southland vs. Manawatu Sep 19 Manawatu -1.90
6 Northland vs. Counties Manukau Sep 19 Counties Manukau -8.40
7 North Harbour vs. Canterbury Sep 20 Canterbury -21.90
8 Tasman vs. Auckland Sep 20 Tasman 12.90


Currie Cup Predictions for Round 7

Team Ratings for Round 7

The basic method is described on my Department home page.

Here are the team ratings prior to this week’s games, along with the ratings at the start of the season.

Current Rating Rating at Season Start Difference
Lions 4.95 3.04 1.90
Western Province 4.66 4.93 -0.30
Blue Bulls 1.79 0.17 1.60
Sharks 1.51 3.43 -1.90
Cheetahs -1.86 -1.75 -0.10
Pumas -6.80 -6.47 -0.30
Griquas -8.93 -7.81 -1.10
Kings -9.23 -9.44 0.20


Performance So Far

So far there have been 24 matches played, 16 of which were correctly predicted, a success rate of 66.7%.

Here are the predictions for last week’s games.

Game Date Score Prediction Correct
1 Kings vs. Cheetahs Sep 11 32 – 24 -4.50 FALSE
2 Sharks vs. Western Province Sep 12 27 – 37 0.90 FALSE
3 Blue Bulls vs. Lions Sep 12 28 – 36 0.80 FALSE
4 Griquas vs. Pumas Sep 12 32 – 15 0.60 TRUE


Predictions for Round 7

Here are the predictions for Round 7. The prediction is my estimated expected points difference with a positive margin being a win to the home team, and a negative margin a win to the away team.

Game Date Winner Prediction
1 Pumas vs. Kings Sep 18 Pumas 5.90
2 Western Province vs. Blue Bulls Sep 18 Western Province 6.40
3 Lions vs. Sharks Sep 19 Lions 6.90
4 Cheetahs vs. Griquas Sep 19 Cheetahs 10.60


How many immigrants?

Before reading on, what proportion of New Zealand residents do you think were born overseas? (more…)