December 14, 2015
Stat of the Week Competition Discussion: December 12 – 18 2015
If you’d like to comment on or debate any of this week’s Stat of the Week nominations, please do so below!
If you’d like to comment on or debate any of this week’s Stat of the Week nominations, please do so below!
So, the preliminary count is up and it’s a victory for opinion polling, if not aesthetics.
As the UMR poll predicted, the two Lockwood ferns were very close, and everything else was well back. Red Peak did a bit worse than in the opinion poll.
It’s notable that each of the two Lockwood ferns got more votes than Red Peak, Hypnoflag, Qualmark Fern, Informal, and Invalid put together.
It is, of course, theoretically possible that there is a Condorcet winner other than one of the Lockwood ferns, because almost anything is theoretically possible in voting-system maths. All you’d need is about three-quarters of the votes ending up at each fern at stage 3 to have Red Peak rather than the other fern next on their preference list.
Stuff has a story from the Sydney Morning Herald, on the claim that smartphones will be obsolete in five years. They don’t believe it. Neither do I, but that doesn’t mean we agree on the reasons. The story thinks not enough people were surveyed:
The research lab surveyed 100,000 people across its native Sweden and 39 other countries.
With around 1.9 billion smartphone users globally, this means ConsumerLab covered just 0.0052 per cent of active users for its study.
This equates to about 2500 in each country; the population of Oberon
If you don’t recognise Oberon, it’s a New South Wales town slightly smaller than Raglan.
Usually, the Sydney Morning Herald doesn’t have such exacting standards for sample size. For example, their recent headline “GST rise backed by voters if other taxes cut: Fairfax-Ipsos poll” was based on 1402 people, about the population of Moerewa.
The survey size is plenty large enough if it was done right. You don’t, as the saying goes, have to eat the whole egg to know that it’s rotten. If you have a representative sample from a population, the size of the population is almost irrelevant to the accuracy of survey estimates from the sample. That’s why opinion polls around the world tend to sample 1000-2000 people, even though that’s 0.02-0.04% of the population of New Zealand, 0.004%-0.009% of the population of Australia, or 0.0003-0.0006% of the population of the USA.
What’s important is whether the survey is representative, which can be achieved either by selecting and weighting people to match the population, or by random sampling, or in practice by a mixture of the two. Unfortunately, the story completely fails to tell us.
Looking at the Ericsson ConsumerLab website, it doesn’t seem that the survey is likely to be representative — or at least, there aren’t any details that would indicate it is. This means it’s like, say, the Global Drug Survey, which also has 100,000 participants, out of over 2 billion people worldwide who use alcohol, tobacco, and other drugs, and which Stuff and the SMH have reported on at great length and without the same skepticism.
From Stuff
Ending your texts with a full stop is truly monstrous. We all know this. Grammar be darned, it just doesn’t look friendly.
Now a study has confirmed it. Researchers led by Binghamton University’s Celia Klin report that text messages ending with a full stop are perceived as being less sincere, probably because the people sending them are heartless.
Or from The Wireless, which at least knows what ‘grammar’ means:
Researchers at the University of Binghamton in the US have released a study concluding that the full stop is evil. Or, in their own words: “Inclusion of a sentence-final period in text messages affects readers’ perception of the sincerity of the messages”.
The quote is correct; that is what the researchers said! But as graphics guru Edward Tufte points out, one of the characteristics of numbers is that they have a magnitude as well as a direction!
How evil is the full stop? Well, assuming the people you text have the same assumptions about writing as undergraduate students in upstate New York, the following graph gives a picture! These are two Normal distributions with the mean and variance that the researchers found for messages with and without a full stop!
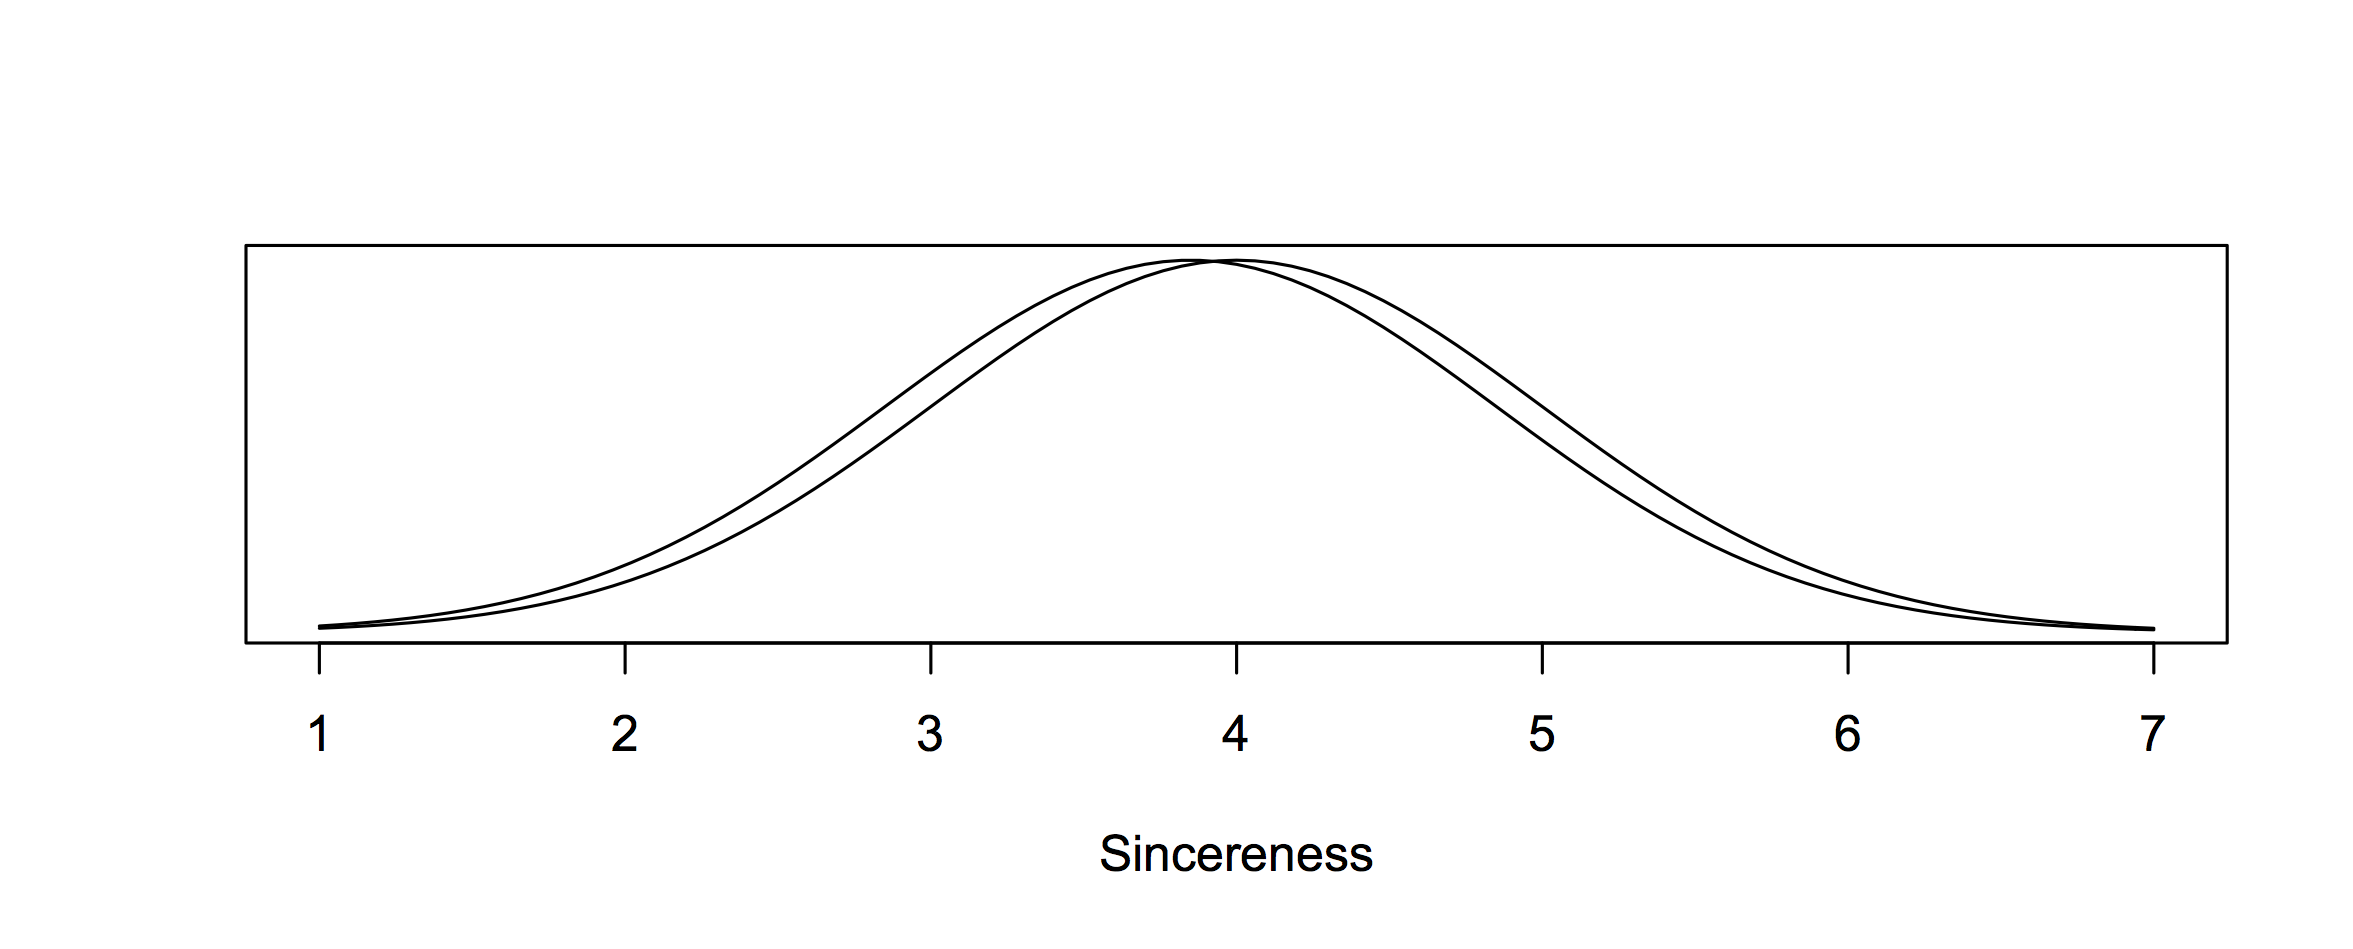
Truly monstrous and evil!!
The press release also says
In some very recent follow-up work, Klin’s team found that a text response with an exclamation mark is interpreted as more, rather than less, sincere.
That’s a relief!!!!
From the @nzlabour twitterwallah, via Matt Nippert
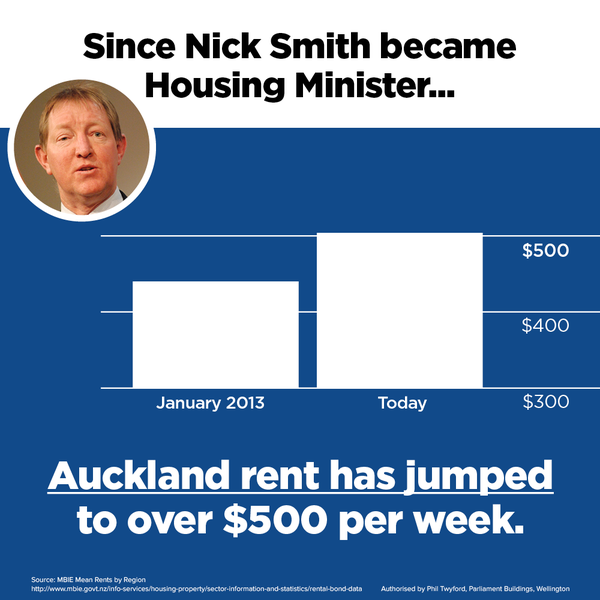
Barcharts start at zero. Other sorts of charts don’t need to, but barcharts do. A line chart cut off at $300 would be ok — though if you were going to do that, you might as well include a longer range of data.
For example, here’s the top couple of inches of the detailed graph from Herald Insights, with the jump under Mr Smith’s administration highlighted in yellow.
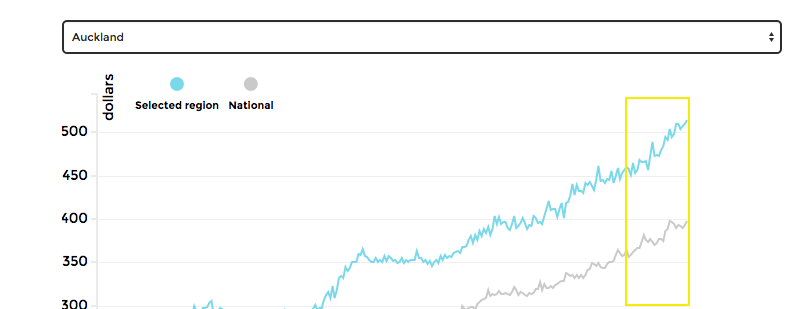
Or you might compare to the increase in median household income for the Auckland region over that period, which was about 9%, and say that affordability of rental housing has decreased by maybe 5% over that time period. Or compare to the increase in minimum wage (7%). Or something.
Representing a time trend for which there’s weekly monthly data by a two-point decapitated bar chart suggests a low opinion of your audience. When Fox News does it, that’s fair enough, but from a New Zealand political party it’s unfortunate.
From the Herald:
For a lot of men, the notion that they have a better sense of direction than women was already a fact, now a scientific study proves it.
Researchers from the Norwegian University of Science and Technology conducted a study where volunteers completed a series of navigation based tasks with brain scans taken in the process.
The results show men have a more adept sense of direction because they use a separate part of their brain to find their way.
The press release is here, and it describes the research as coming from two separate experiments. There’s a link to the research paper, but only for the second experiment involving testosterone. No link is given for the claim about men vs women. I tried the PubMed research database, but the data aren’t in any of the other papers published by the same lead researcher.
The second experiment involved only women, half of whom were given a dose of testosterone. The story says
It was also found when women in the study had a dose of testosterone dropped onto their tongue, their navigational skills improved.
The research paper says
Surprisingly, the specific increase in MTL activity was not accompanied by increased navigation performance in the testosterone group.
That is, they saw changes in brain waves, but no change in navigation. The press release has this right, saying
“We hoped that they would be able to solve more tasks, but they didn’t.”
So, we have two claims. For one of them the evidence isn’t available, for the other it contradicts the story.
The Herald (and others) are reporting an international Ipsos-Mori poll on misperceptions about various national statistics. Two of the questions are things I’ve written about before: crude wealth inequality and proportion of immigrants.
New Zealanders on average estimated that 37% of our population are immigrants. That’s a lot — it’s more than New York or London. The truth is 25%, which is still higher than most of the other countries. Interestingly, the proportion of immigrants in Auckland is quite close to 37%, and a lot of immigration-related news seems to focus on Auckland. I think the scoring system based on absolute differences is unfair to NZ here: saying 37% when the truth is 25% doesn’t seem as bad as saying 10% when the truth is 2% (as in Japan).
We also estimated that 1% of the NZ population own 50% of the wealth. Very similar estimates came from a lot of countries, so I don’t think this is because of coverage of inequality in New Zealand. My guess is that we’re seeing the impact of the Credit Suisse reports (eg, in Stuff), which say 50% of the world’s wealth is owned by the top 1%. Combined with the fact that crude wealth inequality is a bogus statistic anyway, the Credit Suisse reports really seem to do more harm than good for public knowledge.
Each week, we would like to invite readers of Stats Chat to submit nominations for our Stat of the Week competition and be in with the chance to win an iTunes voucher.
Here’s how it works:
Next Monday at midday we’ll announce the winner of this week’s Stat of the Week competition, and start a new one.
If you’d like to comment on or debate any of this week’s Stat of the Week nominations, please do so below!