Posts from May 2016 (41)

May 25, 2016

NRL Predictions for Round 12

Team Ratings for Round 12

The basic method is described on my Department home page.

Here are the team ratings prior to this week’s games, along with the ratings at the start of the season.

Current Rating Rating at Season Start Difference
Broncos 12.27 9.81 2.50
Cowboys 11.90 10.29 1.60
Storm 7.33 4.41 2.90
Sharks 6.19 -1.06 7.20
Bulldogs 2.97 1.50 1.50
Roosters 1.29 11.20 -9.90
Raiders 1.12 -0.55 1.70
Eels 0.22 -4.62 4.80
Rabbitohs -0.34 -1.20 0.90
Panthers -0.43 -3.06 2.60
Sea Eagles -0.48 0.36 -0.80
Dragons -3.79 -0.10 -3.70
Titans -4.16 -8.39 4.20
Warriors -7.72 -7.47 -0.30
Wests Tigers -8.95 -4.06 -4.90
Knights -15.75 -5.41 -10.30


Performance So Far

So far there have been 88 matches played, 51 of which were correctly predicted, a success rate of 58%.
Here are the predictions for last week’s games.

Game Date Score Prediction Correct
1 Rabbitohs vs. Dragons May 19 34 – 24 2.40 TRUE
2 Cowboys vs. Broncos May 20 19 – 18 2.90 TRUE
3 Wests Tigers vs. Knights May 21 20 – 12 10.10 TRUE
4 Warriors vs. Raiders May 21 12 – 38 -1.50 TRUE
5 Sharks vs. Sea Eagles May 21 20 – 12 10.00 TRUE
6 Panthers vs. Titans May 22 24 – 28 8.50 FALSE
7 Bulldogs vs. Roosters May 22 32 – 20 3.50 TRUE
8 Eels vs. Storm May 23 6 – 18 -2.80 TRUE


Predictions for Round 12

Here are the predictions for Round 12. The prediction is my estimated expected points difference with a positive margin being a win to the home team, and a negative margin a win to the away team.

Game Date Winner Prediction
1 Broncos vs. Wests Tigers May 27 Broncos 24.20
2 Dragons vs. Cowboys May 28 Cowboys -12.70
3 Raiders vs. Bulldogs May 29 Raiders 1.10
4 Knights vs. Eels May 30 Eels -13.00


May 24, 2016

Microplummeting

Headline: “Newshub poll: Key’s popularity plummets to lowest level”

Just 36.7 percent of those polled listed the current Prime Minister as their preferred option — down 1.6 percent — from a Newshub poll in November.

National though is steady on 47 percent on the poll — a drop of just 0.3 percent — and similar to the Election night result.

So, apparently, 0.3% is “steady” and 1.6% is a “plummet”.

The reason we quote ‘maximum margin of error’, even though it’s a crude summary, not a good way to describe evidence, underestimates variability, and is a terribly misleading phrase, is that it at least gives some indication of what is worth headlining.  The maximum margin of error for this poll is 3%, but the margin of error for a change is 1.4 times higher, about 4.3%.

That’s the maximum margin of error, for a 50% true value, but it doesn’t make that much difference– I did a quick simulation to check. If nothing happened, the Prime Minister’s measured popularity would plummet or soar by more than 1.6% between two polls about half the time purely from sampling variation.


Knowing what you’re predicting: drug war edition

From Public Address,

The woman was evicted by Housing New Zealand months ago after “methamphetamine contamination” was detected at her home. The story says it’s “unclear” whether the contamination happened during her tenancy or is the fault of a previous tenant.

There’s no allegation of a meth lab being run; the claim is that methamphetamine contamination is the result of someone smoking meth in the house.

The vendors claim the technique has no false positives, but even if we assume they are right about this they mean no false positives in the assay sense; that there definitely is methamphetamine in the sample.  The assay doesn’t guarantee that the tenant ‘allowed’ meth to be smoked in her house. And in this case it doesn’t even seem to guarantee that the contamination happened during her tenancy.

It’s not just this case and this assay, though those are bad enough. If predictive models are going to be used more widely in New Zealand social policy, it’s important that the evaluation of accuracy for those models is broader than just ‘assay error’, and considers the consequences in actual use.

May 23, 2016

Stat of the Week Competition: May 21 – 27 2016

Each week, we would like to invite readers of Stats Chat to submit nominations for our Stat of the Week competition and be in with the chance to win an iTunes voucher.

Here’s how it works:

  • Anyone may add a comment on this post to nominate their Stat of the Week candidate before midday Friday May 27 2016.
  • Statistics can be bad, exemplary or fascinating.
  • The statistic must be in the NZ media during the period of May 21 – 27 2016 inclusive.
  • Quote the statistic, when and where it was published and tell us why it should be our Stat of the Week.

Next Monday at midday we’ll announce the winner of this week’s Stat of the Week competition, and start a new one.

(more…)

Stat of the Week Competition Discussion: May 21 – 27 2016

If you’d like to comment on or debate any of this week’s Stat of the Week nominations, please do so below!

May 22, 2016

Knowing what you’re predicting

From a Sydney Morning Herald story about brain wave reading.

The faux insurgents were asked to hatch a mock terrorist plot by selecting one of four dates in July, one of four locations in Houston and one of four types of bomb, then jot it all down in a letter to their terrorist boss.

EEG caps on, they were later shown a slew of months of the year, US cities and varieties of terror attack on a computer; and when “July”, “Houston” and “bomb” appeared among them, the P300 spikes were big enough to nab all 12 “culprits”.

The brain fingerprinting technique relies on picking up a signal that the brain recognises some piece of information. The people who make the gadgetry claim this can be done with 100% accuracy (not everyone agrees). However, even if the brain waves can be picked up with 100% accuracy, that’s not 100% accuracy for the real question.

Consider DNA evidence. In the ideal case of a high-quality DNA sample from the scene of a crime, and a high-quality sample from a suspect, and the right combination of ancestries, it is possible to be almost 100% sure that the suspect’s DNA (or that of an identical twin) is present in the crime sample. The scene-of-crime sample could be billions of times more likely if the suspect contributed to it than if a random person from the population did. The DNA expert won’t (or shouldn’t) testify that the suspect is almost certainly guilty, because that’s not a DNA question. Even ruling out police fraud or incompetence, the suspect’s DNA could have present in the sample for some innocent reason. Guilt is not a question that capillary electrophoresis can answer.

The situation is worse for the brain fingerprinting technique, because it’s intended to be used before a terrorist attack has been committed, and potentially before the suspects have even committed a crime such as conspiracy.  Maybe they recognised an attack plan because they’d been thinking about it, or because they’d read a Tom Clancy novel about it. Maybe they recognised “July” and “Houston” from baseball and the bomb from somewhere else entirely.  None of these would be counted as an error by the brain wave enthusiasts — they are entirely genuine indications of recognition — but they aren’t specific evidence of past or future crime.


May 21, 2016

Advertising, health promotion, and lots of latex

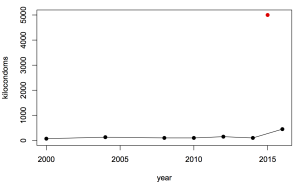
The biennial Olympic condom story is out.  The Rio Olympics are planning to give away 450,000 condoms in the Olympic Village, compared to a mere 150,000 in London, and 90,000 in Sydney (initially 70,000, but they ran out).

This graph shows (with black dots) the publicised numbers for the past Olympics that I could find easily (Torino seems to be keeping quiet, for some reason)

condoms

So, why so many? Condoms are cheap to produce and hard to advertise.  Even buying retail from Amazon you can get 1000 for less than US$150, so 450,000 would cost about US$65k.  In a setting like this, I’m sure the health promotion folks are paying a lot less than that, and the international news coverage implying that Olympic athletes have safe sex is worth far more than the cost of materials.

The red dot? Oh yes. That’s the number handed out by the Health Ministry campaigners at street parties for Carnival this year in Brazil.

May 20, 2016

Briefly

  • The Princeton Web CensusToday I’m pleased to release initial analysis results from our monthly, 1-million-site measurement. This is the largest and most detailed measurement of online tracking to date, including measurements for stateful (cookie-based) and stateless (fingerprinting-based) tracking, the effect of browser privacy tools, and “cookie syncing”.  These results represent a snapshot of web tracking, but the analysis is part of an effort to collect data on a monthly basis and analyze the evolution of web tracking and privacy over time.”
  • Nate Silver on TwitterAn irony is that our early Trump forecasts weren’t based on a statistical model. Just a guesstimate that I got stubborn anchoring myself to. So one lesson is “when in doubt, build a model”. Doesn’t have to be your final answer. But it’s a great starting point. Provides discipline.”
  • From Flowing Data, a visualisation of the changing US diet
  • A visualisation of 24 hours of data flow in a health insurance company: pretty, but not necessarily useful
  • “Mukherjee gives us a Whig history of the gene, told with verve and color, if not scrupulous accuracy. “ A book review/essay at the Atlantic, by Nathaniel Comfort
  • There’s a new White House report on Big Data and Civil RightsUsing case studies on credit lending, employment, higher education, and criminal justice, the report we are releasing today illustrates how big data techniques can be used to detect bias and prevent discrimination. It also demonstrates the risks involved, particularly how technologies can deliberately or inadvertently perpetuate, exacerbate, or mask discrimination.” (via mathbabe.org)

Depends who you ask

There’s a Herald story about sleep

A University of Michigan study using data from Entrain, a smartphone app aimed at reducing jetlag, found Kiwis on average go to sleep at 10.48pm and wake at 6.54am – an average of 8 hours and 6 minutes sleep.

It quotes me as saying the results might not be all that representative, but it just occurred to me that there are some comparison data sets for the US at least.

  • The Entrain study finds people in the US go to sleep on average just before 11pm and wake up on average between 6:45 and 7am.
  • SleepCycle, another app, reports a bedtime of 11:40 for women and midnight for men, with both men and women waking at about 7:20.
  • The American Time Use Survey is nationally representative, but not that easy to get stuff out of. However, Nathan Yau at Flowing Data has an animation saying that 50% of the population are asleep at 10:30pm and awake at 6:30am
  • And Jawbone, who don’t have to take anyone’s word for whether they’re asleep, have a fascinating map of mean bedtime by county of the US. It looks like the national average is after 11pm, but there’s huge variation, both urban-rural and position within your time zone.

These differences partly come from who is deliberately included and excluded (kids, shift workers, the very old), partly from measurement details, and partly from oversampling of the sort of people who use shiny gadgets.

May 18, 2016

Super 18 Predictions for Round 13

Team Ratings for Round 13

The basic method is described on my Department home page.

Here are the team ratings prior to this week’s games, along with the ratings at the start of the season.

Current Rating Rating at Season Start Difference
Crusaders 9.63 9.84 -0.20
Highlanders 7.33 6.80 0.50
Hurricanes 6.75 7.26 -0.50
Chiefs 5.22 2.68 2.50
Waratahs 4.69 4.88 -0.20
Brumbies 2.95 3.15 -0.20
Lions 1.82 -1.80 3.60
Sharks 1.19 -1.64 2.80
Stormers 0.72 -0.62 1.30
Bulls -1.01 -0.74 -0.30
Rebels -5.49 -6.33 0.80
Blues -5.50 -5.51 0.00
Jaguares -7.15 -10.00 2.80
Cheetahs -7.27 -9.27 2.00
Reds -9.27 -9.81 0.50
Force -10.87 -8.43 -2.40
Sunwolves -16.42 -10.00 -6.40
Kings -20.56 -13.66 -6.90


Performance So Far

So far there have been 93 matches played, 65 of which were correctly predicted, a success rate of 69.9%.
Here are the predictions for last week’s games.

Game Date Score Prediction Correct
1 Highlanders vs. Crusaders May 13 34 – 26 0.30 TRUE
2 Rebels vs. Brumbies May 13 22 – 30 -4.50 TRUE
3 Hurricanes vs. Reds May 14 29 – 14 20.70 TRUE
4 Waratahs vs. Bulls May 14 31 – 8 7.90 TRUE
5 Sunwolves vs. Stormers May 14 17 – 17 -14.90 FALSE
6 Cheetahs vs. Kings May 14 34 – 20 17.20 TRUE
7 Lions vs. Blues May 14 43 – 5 7.70 TRUE
8 Jaguares vs. Sharks May 14 22 – 25 -4.50 TRUE


Predictions for Round 13

Here are the predictions for Round 13. The prediction is my estimated expected points difference with a positive margin being a win to the home team, and a negative margin a win to the away team.

Game Date Winner Prediction
1 Crusaders vs. Waratahs May 20 Crusaders 8.90
2 Reds vs. Sunwolves May 21 Reds 11.20
3 Chiefs vs. Rebels May 21 Chiefs 14.70
4 Force vs. Blues May 21 Blues -1.40
5 Lions vs. Jaguares May 21 Lions 13.00
6 Sharks vs. Kings May 21 Sharks 25.30
7 Bulls vs. Stormers May 21 Bulls 1.80