Posts from May 2016 (41)

May 30, 2016

Stat of the Week Competition: May 28 – June 3 2016

Each week, we would like to invite readers of Stats Chat to submit nominations for our Stat of the Week competition and be in with the chance to win an iTunes voucher.

Here’s how it works:

  • Anyone may add a comment on this post to nominate their Stat of the Week candidate before midday Friday June 3 2016.
  • Statistics can be bad, exemplary or fascinating.
  • The statistic must be in the NZ media during the period of May 28 – June 3 2016 inclusive.
  • Quote the statistic, when and where it was published and tell us why it should be our Stat of the Week.

Next Monday at midday we’ll announce the winner of this week’s Stat of the Week competition, and start a new one.

(more…)

Stat of the Week Competition Discussion: May 28 – June 3 2016

If you’d like to comment on or debate any of this week’s Stat of the Week nominations, please do so below!

May 29, 2016

Life expectancy quiz answers

For Wednesday’s quiz:

Remaining life expectancy for NZ men gets down to five years between ages 85 and 90. That’s true for men and women, and for Māori and for non-Māori, and for Pasifika.  (tables here) — the differences in life expectancy at birth have gone away by that age.


I’ma let you finish

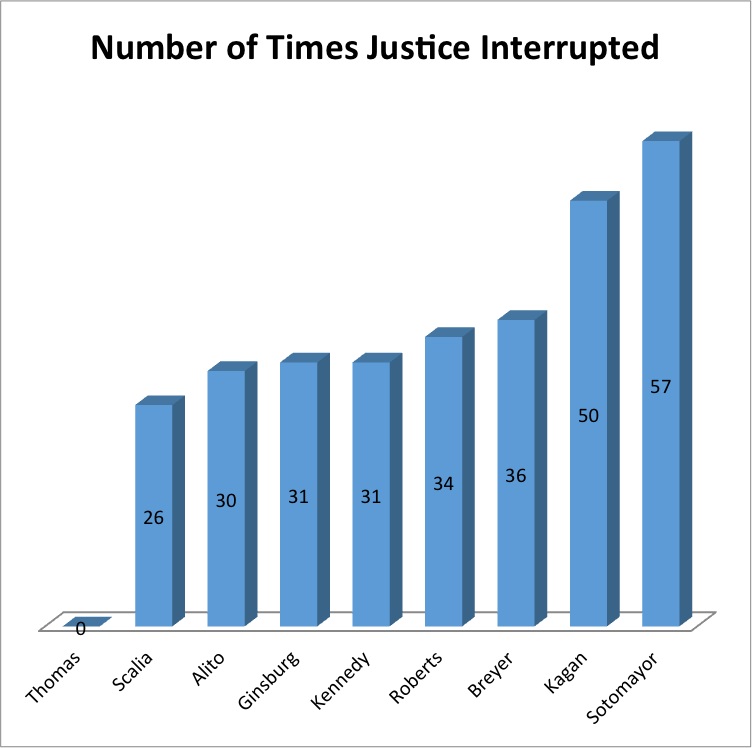
Adam Feldman runs the blog Empirical SCOTUS, with analyses of data on the Supreme Court of the United States. He has a recent post (via Mother Jones) showing how often each judge was interrupted by other judges last year:

Interrupted

For those of you who don’t follow this in detail, Elena Kagan and Sonia Sotomayor are women.

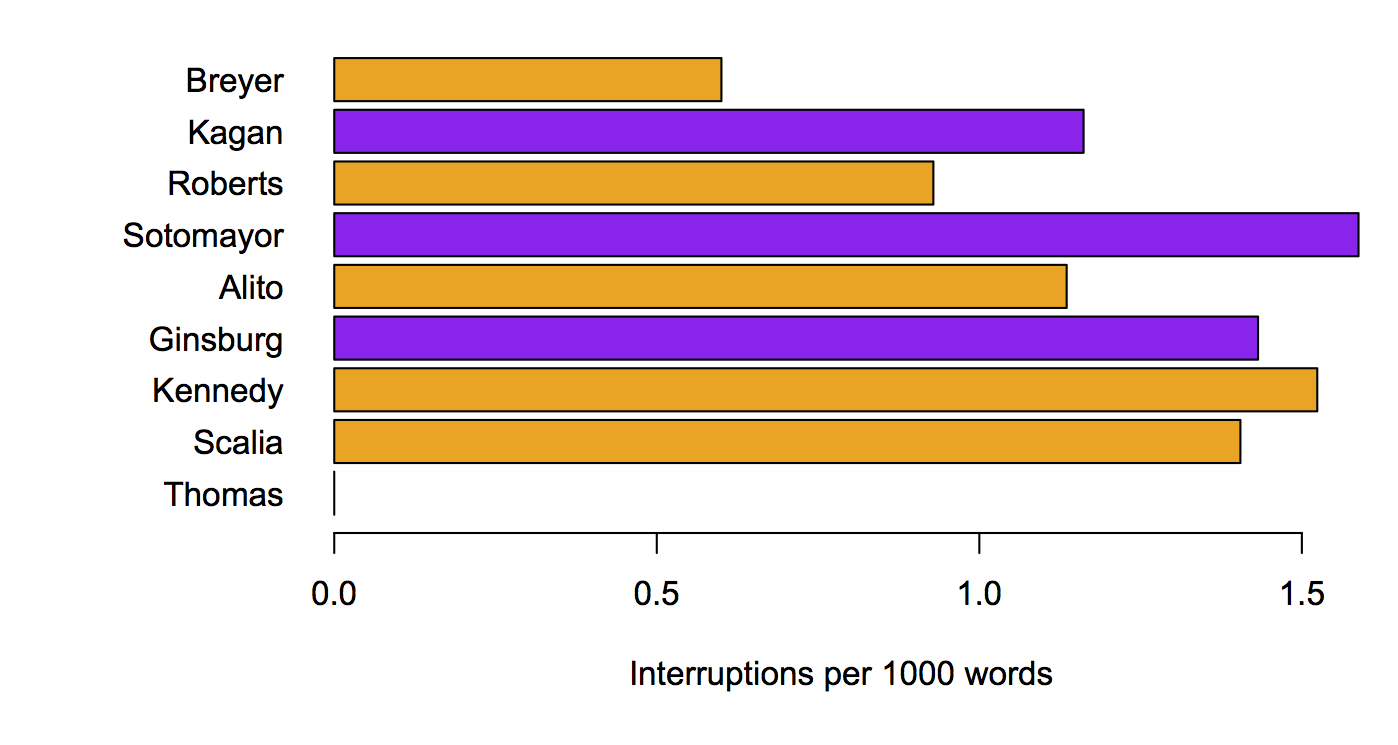
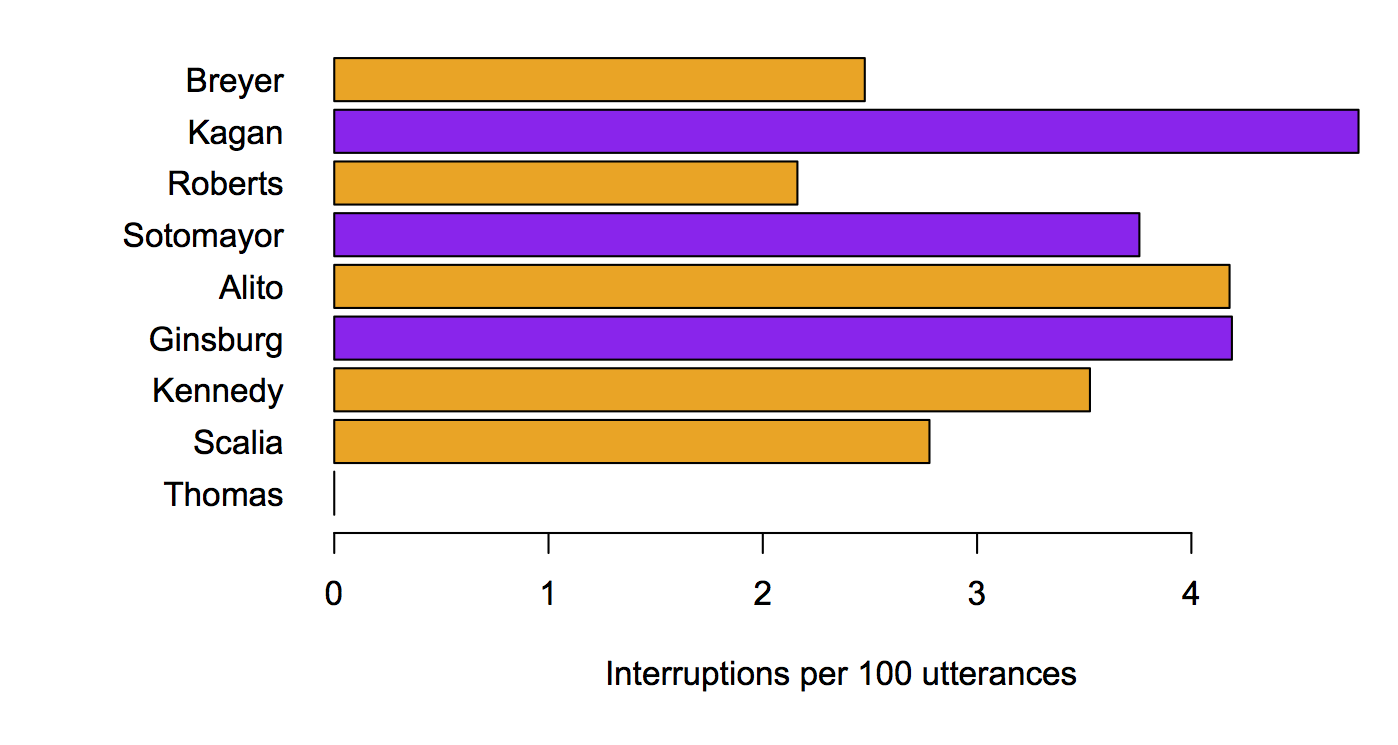
Looking at the other end of the graph, though, shows something that hasn’t been taken into account. Clarence Thomas wasn’t interrupted at all. That’s not primarily because he’s a man; it’s primarily because he almost never says anything.

Interpreting the interruptions really needs some denominator. Fortunately, we have denominators. Adam Feldman wrote another post about them.

Here’s the number interruptions per 1000 words, with the judges sorted in order of  how much they speak

perword

And here’s the same thing with interruption per 100 ‘utterances’

perutterance

It’s still pretty clear that the female judges are interrupted more often (yes, this is statistically significant (though not very)). Taking the amount of speech into account makes the differences smaller, but, interestingly, also shows that Ruth Bader Ginsburg is interrupted relatively often.

Denominators do matter.

May 28, 2016

Defining the question precisely

From the Herald, apparently original (or at least ahead of the UK)

A study from the United Kingdom has found that a glass of beer contains “significantly less” sugar than a can of Coke, a cappuccino or a glass of cordial.

The Campden BRI Food and Innovation study analysed the calorie content of 52 alcoholic drinks and found that most beers have less than 1 gram of sugar per 100ml.

That is, of course, true.  Beer tends to have low sugar because the yeast eats it all.  If anyone’s main concern about the health impact of beer consumption is the sugar, they are indeed worrying about the wrong thing.

Beer does have some other sweet-tasting carbohydrates that are digestible by people, though not by yeast.  More importantly, though, beer has alcohol, and that’s where most of its energy content comes from.

A discussion of sugar in beer, including detailed numbers, focused on health and whether it “makes you fat”, which fails to mention alcohol or total energy content, doesn’t happen by accident.  You’ve got to respect the publicist’s skills.

May 27, 2016

Not wisely but too well

Q: Did you see there’s a new hangover cure? An ice-cream?

A: Really?

Q: Well, the Herald and Reuters think so. How does it work?

A: I think that question assumes facts not in evidence.

Q: How do they say it works, then?

A: It’s got 0.7% raisin tree fruit juice.

Q: That … doesn’t sound like very much.

A: About half a gram, probably. One Panadol has half a gram of paracetamol, so they’re claiming pretty high potency.

Q: But don’t they say it works in rats? There’s a journal and science and stuff! How much did the rats get?

A: They don’t link to the paper. Or give researcher names.

Q: Well, of course not. But you can find it, right?

A: I expect so.


<crickets>


A: Ok. That was relatively annoying.

Q: Didn’t you just need to search for ‘raisin tree juice neuroscience’ or something.

A: No, that gets you copies of this story.

Q: What about on PubMed, where you usually find things?

A: The paper turns out not to have “raisin tree juice” in the title. Eventually I found out the botanical name of the plant and searched for that at the journal website, which has full-text search.

Q: <world’s tiniest violin> How much juice did the rats get?

A: They didn’t get juice. They got a single chemical extracted from the juice, dihydromyricetin, injected.

Q: The ice-creams aren’t going to be injected, though?

A: No, I’m glad to say.

Q: What would be a comparable human dose?

A: They based the rat dose on traditional doses of the dried fruit in humans: “Clinically, the Hovenia dosage range used for hangover is 100–650mg/kg”

Q: So in a hypothetical 70kg pers0n?

A: Works out as 7g-45g. And that’s dry, without the extra water in the juice form.

Q: At least 14 ice-creams. How long did it take the rats’ hangovers to go away after being injected?

A: The rats got the chemical at the same time as the alcohol, so the idea was the hangover was being prevented, perhaps by blocking effects of alcohol in the brain so the rats didn’t really get as drunk.

Q: But if it works by not getting drunk there are cheaper ways.

A: Indeed.
May 26, 2016

Budget visualisations

This will likely be updated as I find them

  1. From Keith Ng. Budget now and over time. This gets special mention for being inflation-adjusted (it’s in 2014 dollars). Doesn’t work on my phone, but works well on a small laptop screen
  2. NZ Herald. Works (though hard to read) on a mobile. Still hard to read on a small laptop screen, but attractive on a large screen. I still have reservations about the bubbles.
  3. Stuff has a set of charts. The surplus/deficit one is nicely clear, though there’s nothing about the financial crisis/recession as an explanation for a lot of it.
  4. The government has interactive charts of Core Crown Revenue, Core Crown Expenditure, and breakdown for a taxpayer. On the last one, they lose points for displaying just income tax, when the Treasury are about the only people who could easily do better.

What budget coverage should do

It’s unavoidable that the government’s presentation of the Budget will try to make it look good, and the the various opposition replies will try to make it look bad. What journalists can do is translate some of it.

For example, the total health budget is going up $2.2 billion over four years. It’s hard to interpret that, because there are at least four trends involved

  1. Dollars are getting smaller
  2. The population is getting larger
  3. The average age is increasing
  4. There are exciting and overpriced new medications available

It should be fairly easy to say whether the increase in the health budget keeps up with 1 and 2. That gives some idea of how much real per capita increase there is to keep up with 3, and whether extra money allocated for 4 will have to compete with what the budget currently buys.

Media organisations should have someone who can look at 1 and 2, and major media organisations should have been able to get an expert opinion of how big 3 is going to be.

Whether real age-adjusted per-capita NZ health expenditure should be stable, increasing, or decreasing is a policy question that we elect representatives to answer. Whether it is stable, increasing, or decreasing is the sort of fact question that we underpay the media to check for us.

May 25, 2016

Life expectancy quiz

Life expectancy at birth for men in NZ is about 77 years, but life expectancy is more complicated than it sounds


(answers here)

Super 18 Predictions for Round 14

Team Ratings for Round 14

The basic method is described on my Department home page.

Here are the team ratings prior to this week’s games, along with the ratings at the start of the season.

Current Rating Rating at Season Start Difference
Crusaders 10.23 9.84 0.40
Highlanders 7.33 6.80 0.50
Hurricanes 6.75 7.26 -0.50
Chiefs 5.60 2.68 2.90
Waratahs 4.08 4.88 -0.80
Brumbies 2.95 3.15 -0.20
Sharks 2.86 -1.64 4.50
Lions 2.72 -1.80 4.50
Stormers 0.59 -0.62 1.20
Bulls -0.87 -0.74 -0.10
Blues -5.34 -5.51 0.20
Rebels -5.87 -6.33 0.50
Cheetahs -7.27 -9.27 2.00
Jaguares -8.05 -10.00 1.90
Reds -9.34 -9.81 0.50
Force -11.03 -8.43 -2.60
Sunwolves -16.35 -10.00 -6.40
Kings -22.22 -13.66 -8.60


Performance So Far

So far there have been 100 matches played, 72 of which were correctly predicted, a success rate of 72%.
Here are the predictions for last week’s games.

Game Date Score Prediction Correct
1 Crusaders vs. Waratahs May 20 29 – 10 8.90 TRUE
2 Reds vs. Sunwolves May 21 35 – 25 11.20 TRUE
3 Chiefs vs. Rebels May 21 36 – 15 14.70 TRUE
4 Force vs. Blues May 21 13 – 17 -1.40 TRUE
5 Lions vs. Jaguares May 21 52 – 24 13.00 TRUE
6 Sharks vs. Kings May 21 53 – 0 25.30 TRUE
7 Bulls vs. Stormers May 21 17 – 13 1.80 TRUE


Predictions for Round 14

Here are the predictions for Round 14. The prediction is my estimated expected points difference with a positive margin being a win to the home team, and a negative margin a win to the away team.

Game Date Winner Prediction
1 Hurricanes vs. Highlanders May 27 Hurricanes 2.90
2 Waratahs vs. Chiefs May 27 Waratahs 2.50
3 Kings vs. Jaguares May 27 Jaguares -10.20
4 Blues vs. Crusaders May 28 Crusaders -12.10
5 Brumbies vs. Sunwolves May 28 Brumbies 23.30
6 Stormers vs. Cheetahs May 28 Stormers 11.40
7 Bulls vs. Lions May 28 Lions -0.10
8 Rebels vs. Force May 29 Rebels 8.70