Posts from July 2016 (39)

July 25, 2016

Briefly

  • US election opinion polls are going to get less accurate for a few weeks, history suggests.
  • The Guardian looks at Twitter abuse directed at politicians (contains abusive language)
  • PBS video about glow-worms — the StatsChat-relevant point is that glow worms are spread much more evenly and less randomly than stars
  • The famous London Tube map, now with walking times between the stations (only stations on the same line, sadly)
  • Emma Hart writes about the Broadcasting Standards Authority’s evidence-based ‘community standards’ at Public Address
  • Interesting graph of income by occupation group in the US over time (Flowing Data)
  • Why there are fewer PokemonGO locations in black neighbourhoods in the  US. (They don’t actually mean ‘why’, they mean ‘how’ — if Nintendo wanted to change this they could have.)

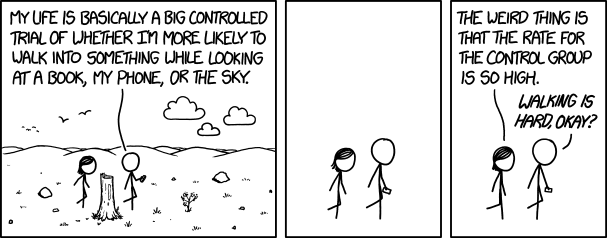
XKCD on controlled comparisons (and PokemonGO)

walking_into_things

Causation implies correlation (almost)

As we all know, variables can easily be correlated when they don’t really have anything to do with each other — especially time series.  There aren’t enough types of trend over time to go around, so variables have to share. tylervigen.com takes advantage of this by making graphs of entertainingly spurious correlations:

1

In the other direction, though, the correlations can be more convincing.  When you see a story claiming that WiFi and cellphones cause Alzheimer’s Disease–

Scientists are still trying to figure out just how much damage the electromagnetic signals emitted from WiFi equipment can actually do to the human brain. But by potentially preventing our brains from flushing beta-amyloid—just by being in close proximity—it’s clear these devices already have the potential for serious damage.

–it’s reassuring to remember that as WiFi has become more common, rates of dementia at a given age have gone down, not up.

It’s logically possible that dementia rates would be going down faster if not for technology, but you’d want pretty good evidence before you started believing that — starting with some sign that the people making the claims understood the basic disease trends.

Stat of the Week Competition: July 23 – 29 2016

Each week, we would like to invite readers of Stats Chat to submit nominations for our Stat of the Week competition and be in with the chance to win an iTunes voucher.

Here’s how it works:

  • Anyone may add a comment on this post to nominate their Stat of the Week candidate before midday Friday July 29 2016.
  • Statistics can be bad, exemplary or fascinating.
  • The statistic must be in the NZ media during the period of July 23 – 29 2016 inclusive.
  • Quote the statistic, when and where it was published and tell us why it should be our Stat of the Week.

Next Monday at midday we’ll announce the winner of this week’s Stat of the Week competition, and start a new one.

(more…)

Stat of the Week Competition Discussion: July 23 – 29 2016

If you’d like to comment on or debate any of this week’s Stat of the Week nominations, please do so below!

July 24, 2016

Disease awareness

One News tonight had a story about venous thromboembolism (VTE) and how people don’t know about it. I couldn’t find a reference for the research, but it wouldn’t surprise me if 50% of people hadn’t heard that term — and many of those who do recognise it might associate it only with long-distance flights.

I can see people wanting to raise awareness, and the story includes a really good animation of what actually happens in a VTE. On the other hand, this is how VTE risk varies with age (source)

Nature Reviews Cardiology 12, 464 (2015). doi:10.1038/nrcardio.2015.83

On top of that, about half of VTE is due to hospitalisation, as the story went on to describe. Given those risk patterns, it’s kind of weird to have the main example in the story be a 20-year-old law student who got a pulmonary embolism without any obvious risk factors.

Disease awareness can be valuable, but it’s probably more useful when it’s modelled on people who are at high, or at least average, risk of the disease.

Tense and depressed

Q: Did you see that sleep disruptions will give kids depression and anxiety in later life?

A: The story in the Herald? From the Daily Mail? Yes

Q: And that this costs the US $120 billion per year? Is that what they really found?

A: No. The $120 billion is for all forms of anxiety and depression. They’re not really claiming it’s all  — or even mostly — due to kids sleeping badly. They just want you to see the number.

Q: What did they really find?

A: They say kids who got less sleep for two nights found less enjoyment in positive things.

Q: Makes sense. You certainly get grumpy after even one night’s disrupted sleep.

A: Pot, kettle.

Q: But that’s just short-term. What happened when the kids grew up?

A: They didn’t. They’re still kids.

Q: How long have they followed them up?

A:  The press release describes the experiment as still ongoing: “they are temporarily restricting sleep in 50 pre-adolescent children between the ages of 7 to 11. “

Q: But the Herald has that in the past tense.

A: Yes. Yes it does.

Q: How long has the research been going on?

A: The grant was funded about two years ago.

Q: Ok, so why does the story talk about “depression and anxiety as adults”?

A: The researchers believe there would be long-term effects in adults.

Q: But this experiment isn’t about that?

A: No.

Q: That’s a relief, actually. If the experiment really was going to make the kids depressed as adults it wouldn’t seem ethical.

A: No, though we also could talk about the ethics of news stories that imply parents are at fault for everything.

July 22, 2016

Abstract isn’t the same as logical

Suppose, to copy a classic example, you are a checking license compliance for a pub and have to  make sure only people 18 or older are drinking alcohol.  There are four people present. Alice is drinking beer. Boris is drinking water. Chris is fifteen. Doris is 50. Do you need to:

For most people, this is pretty easy.

The Herald has an equivalent puzzle that has been made pointless and abstract, in terms of letters and numbers, and lots of people get it wrong. That’s fine, except the headline is “Card test reveals how logical you are.”  Manipulating conditional implications abstractly is a useful specialised skill, but it’s not the same as logic.  In a similar way, manipulating probabilities symbolically is a useful specialised skill, but it’s not the same as understanding risk.

When it’s just a game, as in the story, this isn’t a big deal. But when you have a real question, communicating it so that it’s easy to answer rather than pointlessly hard does matter.


July 21, 2016

The ‘breakthrough’ story

This is the front page of The Age, Melbourne’s serious newspaper, today:

Cn12L8bUAAAe19K

As Jack Scanlan observed on Twitter, it’s great to see science on the front page. On the other hand, the story is an example of how the ‘breakthrough’ narrative dominates science stories (as Scanlan himself wrote in Lateral magazine back in February).

The description of the research itself is fine, but the impact is a bit overplayed

“The idea is to screen people who aren’t displaying symptoms,” Dr Cheng said. “We can then identify their risk of developing Alzheimer’s disease and intervene earlier.”

Eventually that’s going to work, but right now we don’t know how to intervene and so there’s not much point in doing it earlier.

From the viewpoint of journalism, though, there’s another issue. Just in New Zealand papers over the past few years we have:

  • Has a 15-year-old found a way to test for Alzheimer’s? (Herald, 7/2015)
  • Blood test could detect dementia (Herald, 3/2014)
  • Blood test could give ten year warning of Alzheimer’s (Herald, 6/2015)
  • Alzheimer’s blood test hope (Herald, 7/2014)
  • Excitement over Alzheimer’s discovery (Otago Daily Times, 4/2016)

The last one even uses the same approach, measuring microRNAs in blood samples.  It’s a good idea; it’s good science; it may eventually be useful. It’s not a unique breakthrough.

July 20, 2016

Another set of rugby predictions

The Herald has a new set of rugby team ratings going back into history, with pretty graphs as well, based on work by UoA student Wil Undy.  These are ‘Elo’ ratings in the modified sense that fivethirtyeight.com uses the term. The original Elo method was for chess, where you only get a winner, not a margin of victory, but it’s been updated to use the extra information from the winning margin.

So, how are these different from the StatsChat ratings?   The methods are fairly similar: there’s a rating for each team, which is updated using the results of each game, and there’s a tuning parameter that controls how much each new game is allowed to change the rating.

The primary difference is how the ratings are calibrated. In David Scott’s system the difference in ratings estimates the margin; in an Elo system the difference in ratings can be converted into a predicted probability of winning.

Just based on crude probability of getting the right winner, the StatsChat predictions may be very slightly better — for the last three seasons of Super 15, David Scott has got 65%, 66%, and 68% right, and the Herald claims 64-65% for Will Undy’s model.  On the other hand, if you actually want to bet, a predicted probability could be more useful than a predicted margin.

The graph for the Crusaders shows one interesting feature of the model

cru-elo

The Crusaders’s rating has improved through the season in every season for the past 15 years, suggesting that the between-season correction is too strong, or that memory for more than one year into the past might be helpful.


Rugby fans will be able to find other interesting patterns and places where tweaks could be made. What’s interesting about both Wil Undy’s new method and David Scott’s approach is how well you can do with a formula that knows nothing about rugby or rugby players and only remembers one number for each team.  These models are most interesting as a baseline: how much better can you do by following the news and taking advantage of actual rugby knowledge?

Super 18 Predictions for Round 18

Team Ratings for Round 18

The basic method is described on my Department home page.

Here are the team ratings prior to this week’s games, along with the ratings at the start of the season.

Current Rating Rating at Season Start Difference
Hurricanes 9.50 7.26 2.20
Crusaders 9.28 9.84 -0.60
Highlanders 8.65 6.80 1.90
Chiefs 7.17 2.68 4.50
Waratahs 5.12 4.88 0.20
Lions 5.06 -1.80 6.90
Brumbies 3.18 3.15 0.00
Stormers 2.41 -0.62 3.00
Sharks 0.79 -1.64 2.40
Bulls -1.13 -0.74 -0.40
Blues -2.11 -5.51 3.40
Jaguares -7.37 -10.00 2.60
Cheetahs -9.10 -9.27 0.20
Rebels -9.53 -6.33 -3.20
Force -10.81 -8.43 -2.40
Reds -11.74 -9.81 -1.90
Sunwolves -20.76 -10.00 -10.80
Kings -21.84 -13.66 -8.20


Performance So Far

So far there have been 135 matches played, 98 of which were correctly predicted, a success rate of 72.6%.
Here are the predictions for last week’s games.

Game Date Score Prediction Correct
1 Blues vs. Waratahs Jul 15 34 – 28 -4.50 FALSE
2 Reds vs. Rebels Jul 15 28 – 31 1.90 FALSE
3 Sharks vs. Sunwolves Jul 15 40 – 29 27.50 TRUE
4 Crusaders vs. Hurricanes Jul 16 10 – 35 7.10 FALSE
5 Highlanders vs. Chiefs Jul 16 25 – 15 4.30 TRUE
6 Brumbies vs. Force Jul 16 24 – 10 18.00 TRUE
7 Stormers vs. Kings Jul 16 52 – 24 27.70 TRUE
8 Cheetahs vs. Bulls Jul 16 17 – 43 -1.50 TRUE
9 Jaguares vs. Lions Jul 16 34 – 22 -11.20 FALSE


Predictions for Round 18

Here are the predictions for Round 18. The prediction is my estimated expected points difference with a positive margin being a win to the home team, and a negative margin a win to the away team.

Game Date Winner Prediction
1 Brumbies vs. Highlanders Jul 22 Highlanders -1.50
2 Hurricanes vs. Sharks Jul 22 Hurricanes 12.70
3 Lions vs. Crusaders Jul 23 Crusaders -0.20
4 Stormers vs. Chiefs Jul 23 Chiefs -0.80