Posts from June 2017 (28)

June 19, 2017

Stat of the Week Competition: June 17 – 23 2017

Each week, we would like to invite readers of Stats Chat to submit nominations for our Stat of the Week competition and be in with the chance to win an iTunes voucher.

Here’s how it works:

  • Anyone may add a comment on this post to nominate their Stat of the Week candidate before midday Friday June 23 2017.
  • Statistics can be bad, exemplary or fascinating.
  • The statistic must be in the NZ media during the period of June 17 – 23 2017 inclusive.
  • Quote the statistic, when and where it was published and tell us why it should be our Stat of the Week.

Next Monday at midday we’ll announce the winner of this week’s Stat of the Week competition, and start a new one.

(more…)

Stat of the Week Competition Discussion: June 17 – 23 2017

If you’d like to comment on or debate any of this week’s Stat of the Week nominations, please do so below!

June 18, 2017

Unbiased anecdote is still anecdote

RadioNZ has a new “Healthy or Hoax” series looking at popular health claims. The first one, on coconut oil, is a good example both of what it does well, and of the difficulties in matching the claims and science.

The serious questions about coconut oil are about changes in blood fats and in insulin resistance when saturated fats replace various other components of the diet.  Replacing sugar and starch by  saturated fat is probably good; replacing, say,  monounsaturated fat by saturated fat probably isn’t. But in both cases the effects are small and are primarily on things you don’t notice, like your cholesterol level. That’s why there’s disagreement, because it’s actually hard to tell, given all the individual variability between people.

The superfood questions about coconut oil are about whether eating loads of it makes dramatic improvements in your health over a period of a few weeks.  There’s no reason to think it does, and the story quotes various people including Grant Schofield — who is at one end of the spectrum of respectable views on this subject — as saying so.

That’s all fine, but a big part of the story is about Kate Pereyra Garcia trying it for herself.  If the scientists — any subset of them — are right, a study on one person isn’t going to say anything helpful.  A one-person experience might disprove some of the extreme superfoodie claims, but no-one who believes those claims is likely to pay attention.

So, on one hand, the series looks like a great way to bring up the relatively boring evidence on a range of health topics. On the other hand, it’s reinforcing the concept of individual testimonials as a way of evaluating health effects.  If it was that easy to tell, we wouldn’t still be arguing about it.

Briefly

  • A simulation of measles spreading through communities with different vaccination levels.
  • Update on the prosecution of the former government statistician of Greece, Andreas Georgiou, apparently because the right numbers weren’t popular.
  • Blind testing suggests wine tasters do much better than chance, but nowhere near as well as they’d like you to think.
  • “It’s not that people don’t like Mexican food. The reason was that the system had learned the word “Mexican” from reading the Web.” On reducing the ethnic and gender biases of automated text analysis
  • Herald Insights visualisation of crime patterns in New Zealand. Yes, there’s a denominator problem; no, the obvious fixes wouldn’t help.


June 15, 2017

One poll is not enough

As Patrick Gower said recently about the new Newshub/Reid Research polls

“The interpretation of data by the media is crucial. You can have this methodology that we’re using and have it be bang on and perfect, but I could be too loose with the way I analyse and present that data, and all that hard work can be undone by that. So in the end, it comes down to me and the other people who present it.”

This evening, Newshub has the headline Poll: Labour crumbles, falling towards defeat. That’s based on a difference between two polls of 4.2% for Labour on its own, or 3.1% for a Labour/Greens alliance.

The poll has a ‘maximum margin of error’ of 3.1%, but that’s for support in this poll. For change between two polls, the maximum margin of error from the same assumptions is larger: 4.4%.

There’s pretty good evidence the decrease for Labour is likely to be real: at 25-30% support the random variation is smaller.  Even so, an uncertainty interval based on the usual optimistic assumptions about sampling goes from a decrease of 0.3% to a decrease of 8.1%.

The smaller change for the Greens/Labour alliance, this could easily just be the sort of thing that happens with polling. Or, it could be a real crumble. Or anything in between

Certainly, even a 3.1% decrease in support is potentially a big deal, and could be news. The problem is that a single standard NZ opinion poll isn’t up to the task of detecting it reliably. Whether it’s news or not is up to the judgement (or guesswork) of the media, and the demands of the audience.  Even that would be ok, if everyone admitted the extent to which the data just serve to dilute the reckons, rather than glossing over all the uncertainty.

If anyone wants less-exciting summaries, my current recommendation for an open, transparent, well-designed NZ poll aggregator is this by Peter Ellis.

We’re not number three

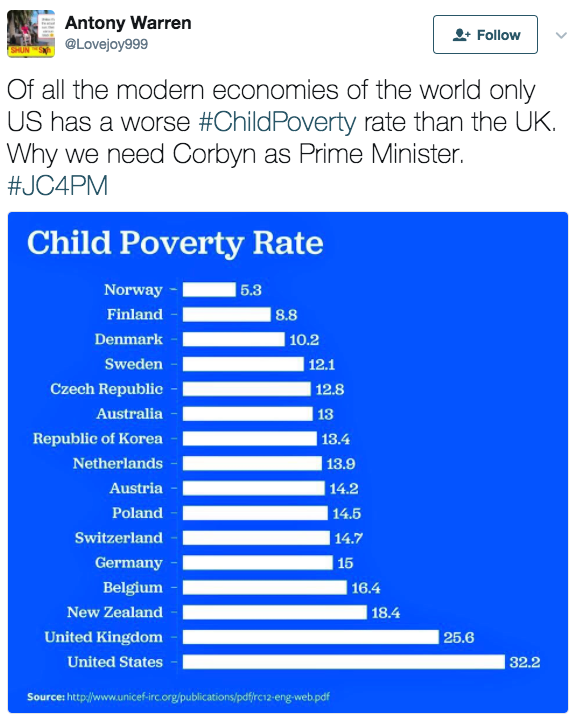
From the Twitter, via Graeme Edgeler

childpov

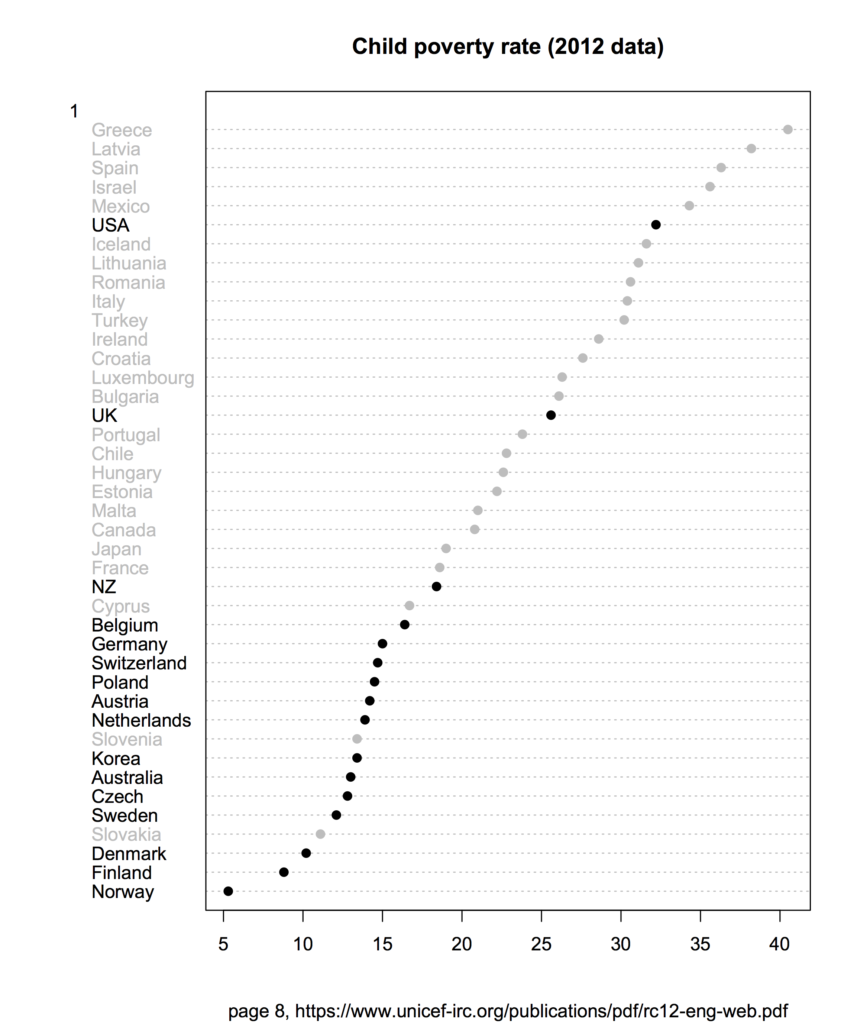
As Graeme points out, the nice thing about having a link included is that you can check the report (PDF, p8) and find out the claim isn’t true — at least by the source’s definitions.

This one is redrawn to use all the data, with the countries previously left out coloured grey. There’s a pattern.
fullchildpov


June 14, 2017

Comparing sources

The Herald has a front-page-link “Daily aspirin deadlier than we thought”, for a real headline “Daily aspirin behind more than 3000 deaths a year, study suggests”.  The story (from the Daily Telegraph) begins

Taking a daily aspirin is far more dangerous than was thought, causing more than 3000 deaths a year, a major study suggests.

Millions of pensioners should reconsider taking pills which are taken by almost half of elderly people to ward off heart attacks and strokes, researchers said.

The study by Oxford University found that those over the age of 75 who take the blood-thinning pills are 10 times more likely than younger patients to suffer disabling or fatal bleeds.

The BBC also has a report on this research. Their headline is Aspirin ‘major bleed’ warning for over-75s, and the story starts

People over 75 taking daily aspirin after a stroke or heart attack are at higher risk of major – and sometimes fatal – stomach bleeds than previously thought, research in the Lancet shows.

Scientists say that, to reduce these risks, older people should also take stomach-protecting PPI pills.

But they insist aspirin has important benefits – such as preventing heart attacks – that outweigh the risks.

The basic message from the same underlying research seems very different. Sadly, neither story links to the open-access research paper, which has very good sections on the background to the research and what this new study added.

Basically, we know that aspirin reduces blood clotting.  This has good effects — reducing the risk of heart attacks and strokes — and also bad effects — increasing the risk of bleeding.   We do randomised trials to find out whether the benefits exceed the risks, and in the randomised trials they did for aspirin. However, the randomised trials were mostly in people under 75.

The new study looks at older people, but it wasn’t a randomised trial: everyone in the study was taking aspirin, and there was no control group.  The main comparisons were by age. Serious stomach bleeding was a lot more common in the oldest people in the study, so unless the beneficial effects of aspirin were also larger in these people, the tradeoff might no longer be favourable.

In particular, as the Herald/Telegraph story says, the tradeoff might be unfavourable for old-enough people who hadn’t already had a heart attack or stroke. That’s one important reason for the difference between the two stories.  The research only looked at people who had previously had a heart attack or stroke (or some similar reason to take aspirin). The BBC story focused mostly on these people (who should still take aspirin, but also maybe an anti-ulcer drug); the Herald/Telegraph story focused mostly on those taking aspirin purely as a precaution.

So, even though the Herald/Telegraph story was going for the scare headlines, the content was potentially helpful: absent any news coverage, the healthy aspirin users would be less likely to bring up the issue with their doctors.
 

June 13, 2017

Appropriate subdivisions

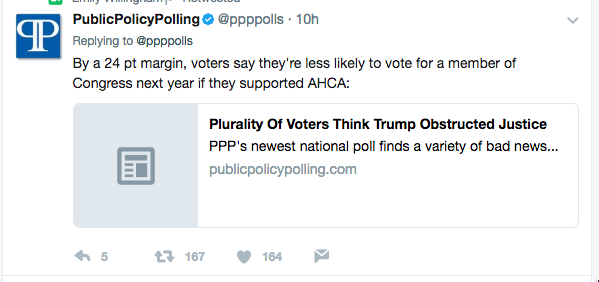
From Public Policy Polling on Twitter, a finding that voters are less likely to vote for a member of Congress if they supported the Republican anti-healthcare bill

ppp

The problem with this sort of claim, as we’ve seen for NZ examples in the past, is that more than 24% of voters already have ‘not in a million years’ as the baseline willingness-to-support for some candidates. Maybe this vote would just change that to `not in two million years’.

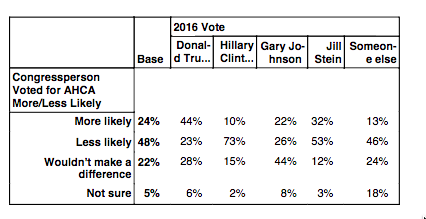
Since Public Policy Polling are a reputable survey company (even though I’m not a fan) , they publish detailed survey results (PDF).  In these results, they break down the healthcare question by self-reported vote in the 2016 election
ppp-table
And, as you’d expect, the detailed story is different.  People who voted for Clinton think the Republican healthcare bill is terrible; people who voted for Trump think it’s basically ok. The net 24% who might change their vote might be better described a mixture of a net 50% imaginary `loss’ of people who already weren’t voting Republican, and a net 20% imaginary `gain’ of people who already were.

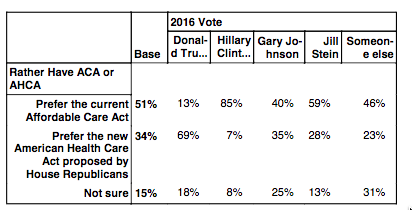
What’s more striking than the 24% vs 48% overall percentage is that as many as 23% of Trump voters are willing to say something negative about the bill. Still, as an indication that even the hopeful news is unclear, consider this table
ppp-table2
Only 13% of Trump voters prefer the current healthcare law, so the 23% who would penalise a Congressperson who voted for the new law includes at least 10% who actually prefer the new law or who aren’t sure.


NRL Predictions for Round 15

Team Ratings for Round 15

The basic method is described on my Department home page.

Here are the team ratings prior to this week’s games, along with the ratings at the start of the season.

Current Rating Rating at Season Start Difference
Storm 8.01 8.49 -0.50
Raiders 4.96 9.94 -5.00
Broncos 4.94 4.36 0.60
Sharks 4.67 5.84 -1.20
Roosters 4.17 -1.17 5.30
Cowboys 4.05 6.90 -2.90
Panthers 3.58 6.08 -2.50
Sea Eagles 1.95 -2.98 4.90
Dragons -0.54 -7.74 7.20
Warriors -1.60 -6.02 4.40
Eels -3.57 -0.81 -2.80
Bulldogs -3.76 -1.34 -2.40
Rabbitohs -4.06 -1.82 -2.20
Titans -4.21 -0.98 -3.20
Wests Tigers -8.74 -3.89 -4.80
Knights -11.88 -16.94 5.10


Performance So Far

So far there have been 107 matches played, 63 of which were correctly predicted, a success rate of 58.9%.
Here are the predictions for last week’s games.

Game Date Score Prediction Correct
1 Sharks vs. Storm Jun 08 13 – 18 1.20 FALSE
2 Sea Eagles vs. Knights Jun 09 18 – 14 19.80 TRUE
3 Broncos vs. Rabbitohs Jun 09 24 – 18 13.80 TRUE
4 Titans vs. Warriors Jun 10 12 – 34 5.60 FALSE
5 Panthers vs. Raiders Jun 10 24 – 20 1.70 TRUE
6 Eels vs. Cowboys Jun 10 6 – 32 -0.20 TRUE
7 Wests Tigers vs. Roosters Jun 11 18 – 40 -7.10 TRUE
8 Bulldogs vs. Dragons Jun 12 16 – 2 -2.30 FALSE


Predictions for Round 15

Here are the predictions for Round 15. The prediction is my estimated expected points difference with a positive margin being a win to the home team, and a negative margin a win to the away team.

Game Date Winner Prediction
1 Rabbitohs vs. Titans Jun 16 Rabbitohs 3.70
2 Storm vs. Cowboys Jun 17 Storm 7.50
3 Sharks vs. Wests Tigers Jun 17 Sharks 16.90
4 Eels vs. Dragons Jun 18 Eels 0.50


June 12, 2017

Stat of the Week Competition: June 10 – 16 2017

Each week, we would like to invite readers of Stats Chat to submit nominations for our Stat of the Week competition and be in with the chance to win an iTunes voucher.

Here’s how it works:

  • Anyone may add a comment on this post to nominate their Stat of the Week candidate before midday Friday June 16 2017.
  • Statistics can be bad, exemplary or fascinating.
  • The statistic must be in the NZ media during the period of June 10 – 16 2017 inclusive.
  • Quote the statistic, when and where it was published and tell us why it should be our Stat of the Week.

Next Monday at midday we’ll announce the winner of this week’s Stat of the Week competition, and start a new one.

(more…)