October 23, 2017
Stat of the Week Competition Discussion: October 21 – 27 2017
If you’d like to comment on or debate any of this week’s Stat of the Week nominations, please do so below!
If you’d like to comment on or debate any of this week’s Stat of the Week nominations, please do so below!
The headline:
Kiwis want cannabis legalised – Herald Facebook poll
And in the text
An unscientific poll run on the NZ Herald Facebook page shows that the majority of New Zealanders want to see cannabis legalised.
The poll doesn’t show anything of the sort, because bogus polls can’t show anything of the sort.
According to the story there were about 15,500 ‘yes’ responses. A bogus poll doesn’t tell you anything about people who didn’t participate. Even if we knew these were different people and all New Zealanders, it would still be just under half a percent of, say, enrolled voters.
It was just a few months ago that Nicholas Jones in the Herald reported a real poll, which asked a more detailed set of questions and tried to sample a representative group of people. That adds information to the debate. Headlines based on bogus polls subtract information.
The basic method is described on my Department home page.
Here are the team ratings prior to this week’s games, along with the ratings at the start of the season.
| Current Rating | Rating at Season Start | Difference | |
|---|---|---|---|
| Canterbury | 15.56 | 14.78 | 0.80 |
| Wellington | 11.41 | -1.62 | 13.00 |
| Taranaki | 7.81 | 7.04 | 0.80 |
| North Harbour | 6.27 | -1.27 | 7.50 |
| Tasman | 2.69 | 9.54 | -6.90 |
| Counties Manukau | 2.02 | 5.70 | -3.70 |
| Otago | 1.61 | -0.34 | 2.00 |
| Auckland | -0.33 | 6.11 | -6.40 |
| Bay of Plenty | -1.50 | -3.98 | 2.50 |
| Waikato | -3.17 | -0.26 | -2.90 |
| Northland | -3.19 | -12.37 | 9.20 |
| Manawatu | -4.54 | -3.59 | -1.00 |
| Hawke’s Bay | -13.26 | -5.85 | -7.40 |
| Southland | -23.99 | -16.50 | -7.50 |
So far there have been 70 matches played, 48 of which were correctly predicted, a success rate of 68.6%.
Here are the predictions for last week’s games.
| Game | Date | Score | Prediction | Correct | |
|---|---|---|---|---|---|
| 1 | Taranaki vs. Manawatu | Oct 11 | 46 – 25 | 17.90 | TRUE |
| 2 | Wellington vs. Northland | Oct 12 | 36 – 18 | 18.70 | TRUE |
| 3 | Auckland vs. Canterbury | Oct 13 | 27 – 32 | -13.40 | TRUE |
| 4 | Bay of Plenty vs. Waikato | Oct 14 | 36 – 32 | 6.00 | TRUE |
| 5 | Otago vs. Southland | Oct 14 | 43 – 19 | 30.80 | TRUE |
| 6 | Counties Manukau vs. Tasman | Oct 14 | 52 – 30 | -0.80 | FALSE |
| 7 | North Harbour vs. Taranaki | Oct 15 | 64 – 33 | -3.50 | FALSE |
| 8 | Hawke’s Bay vs. Manawatu | Oct 15 | 36 – 31 | -7.10 | FALSE |
Here are the predictions for the Mitre 10 Cup Semi-Finals. The prediction is my estimated expected points difference with a positive margin being a win to the home team, and a negative margin a win to the away team.
| Game | Date | Winner | Prediction | |
|---|---|---|---|---|
| 1 | Wellington vs. Northland | Oct 20 | Wellington | 18.60 |
| 2 | Bay of Plenty vs. Otago | Oct 21 | Bay of Plenty | 0.90 |
| 3 | Canterbury vs. North Harbour | Oct 21 | Canterbury | 13.30 |
| 4 | Taranaki vs. Tasman | Oct 21 | Taranaki | 9.10 |
The basic method is described on my Department home page.
Here are the team ratings prior to this week’s games, along with the ratings at the start of the season.
Note that Cheetahs2 is the Cheetahs team in weeks when the first team is playing in the Pro14.
| Current Rating | Rating at Season Start | Difference | |
|---|---|---|---|
| Cheetahs | 4.33 | 4.33 | -0.00 |
| Sharks | 3.87 | 2.15 | 1.70 |
| Lions | 3.84 | 7.41 | -3.60 |
| Western Province | 3.62 | 3.30 | 0.30 |
| Blue Bulls | 0.67 | 2.32 | -1.70 |
| Pumas | -8.75 | -10.63 | 1.90 |
| Griquas | -10.19 | -11.62 | 1.40 |
| Cheetahs2 | -30.14 | -30.00 | -0.10 |
So far there have been 42 matches played, 28 of which were correctly predicted, a success rate of 66.7%.
Here are the predictions for last week’s games.
| Game | Date | Score | Prediction | Correct | |
|---|---|---|---|---|---|
| 1 | Blue Bulls vs. Pumas | Oct 13 | 52 – 32 | 12.80 | TRUE |
| 2 | Lions vs. Cheetahs | Oct 14 | 44 – 17 | 2.50 | TRUE |
| 3 | Sharks vs. Western Province | Oct 14 | 20 – 31 | 5.90 | FALSE |
Here are the predictions for the Currie Cup Final. The prediction is my estimated expected points difference with a positive margin being a win to the home team, and a negative margin a win to the away team.
| Game | Date | Winner | Prediction | |
|---|---|---|---|---|
| 1 | Sharks vs. Blue Bulls | Oct 21 | Sharks | 7.70 |
| 2 | Western Province vs. Lions | Oct 21 | Western Province | 4.30 |
Each week, we would like to invite readers of Stats Chat to submit nominations for our Stat of the Week competition and be in with the chance to win an iTunes voucher.
Here’s how it works:
Next Monday at midday we’ll announce the winner of this week’s Stat of the Week competition, and start a new one.
If you’d like to comment on or debate any of this week’s Stat of the Week nominations, please do so below!
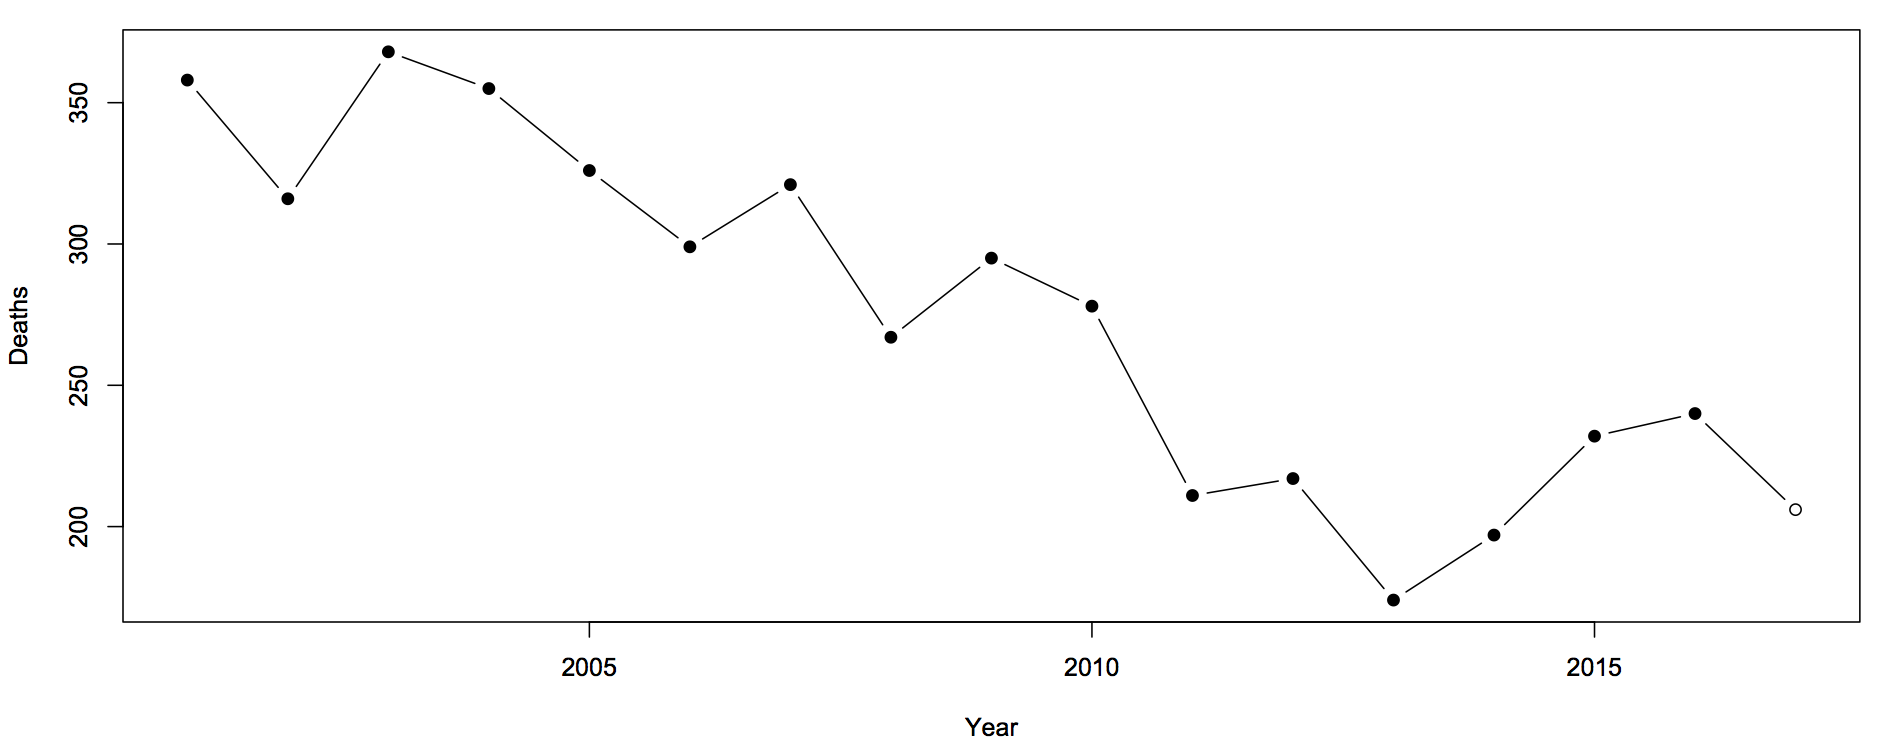
Sam Warburton (the economist, not the rugby player) has been writing about the recent increase in road deaths. Here are the counts (with partial 2017 data)
The first question you should ask is whether this is explained by population increases or by driving increases. That is, we want rates — deaths per unit of distance travelled
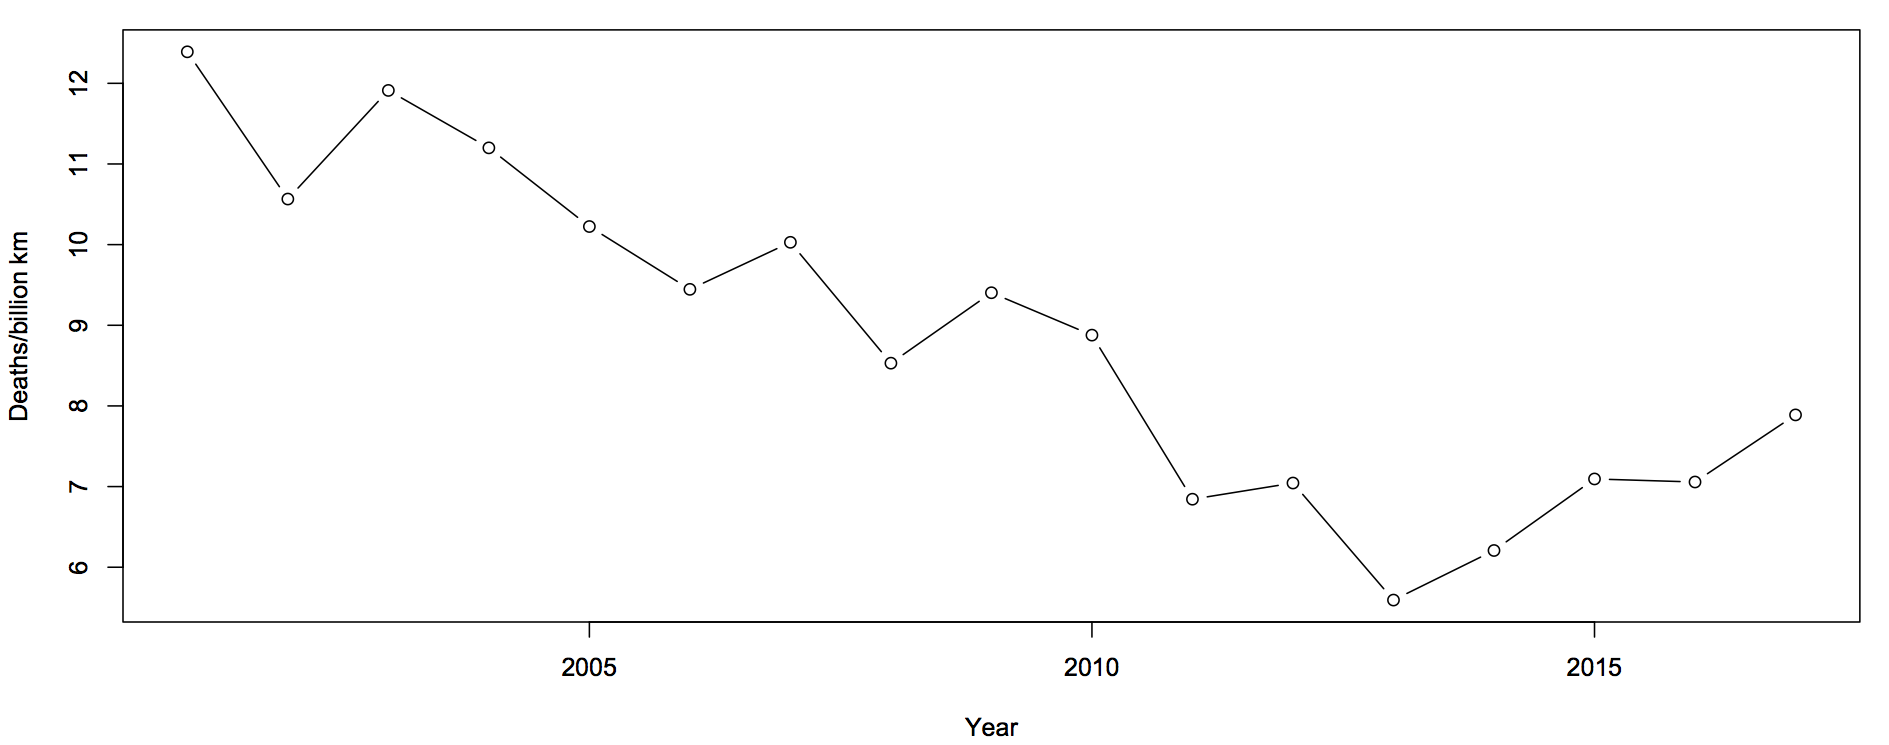
There’s still an increase, but now the 2017 partial data are in line with the increase. The increase cannot be explained simply by more cars being on the roads.
The next question is about uncertainty. Traditionally, news stories about the road toll were based on one month of data and random variation could explain it all. We still need a model for how much random variation to expect. What I said before was
The simplest mathematical model for counts is the Poisson process. If dying in a car crash is independent for any two people in NZ, and the chance is small for any person (but not necessarily the same for different people) then number of deaths over any specified time period will follow a Poisson distribution. The model cannot be exactly right — multiple fatalities would be much rarer if it were — but it is a good approximation, and any more detailed model would lead to more random variation in the road toll than the Poisson process does.
In that case I was arguing that there wasn’t any real evidence of a change, so using an underestimate of the random variation made my case harder. In this case I’m arguing the change is larger than random variation, so I need to make sure I don’t underestimate random variation.
What I did was fit a Bayesian model with two extra random components. The first was the trend over time. To avoid making assumptions about the shape of the trend I just assumed that the difference between adjacent years was relatively small and random. The second random component was a difference between the trend value for a year and the ‘true’ rate for that year. On top of all of that, there’s Poisson variation. Since the size of the two additional random components is estimated from the data, they will capture all the variation.
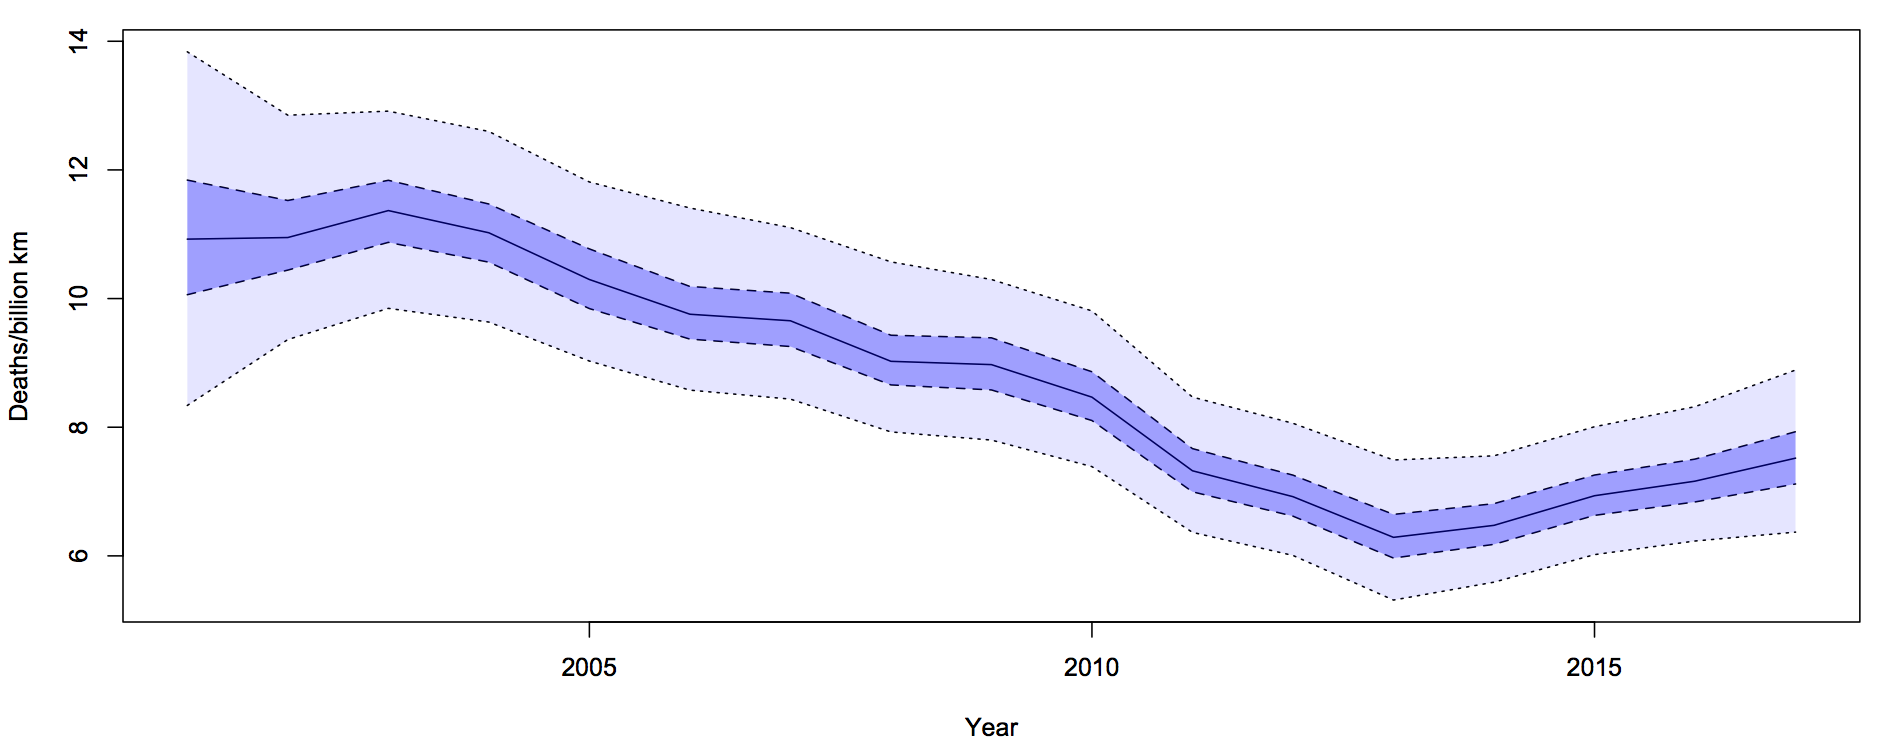
For each year, there is a 50% probability that the underlying rate is in the darker blue interval, and a 95% probability it’s in the light blue interval. The trend is smoother than the data because the data has both the Poisson variation and the extra year-specific deviation. There’s more uncertainty in 2001 because we didn’t use pre-2001 data to tie it down at all, but that won’t affect the later half of the time period much.
It looks from the graph as though there was a minimum in 2013-14 and an increased rate since then. One of the nice things about these Bayesian models is that you can easily and meaningfully ask for the probability that each year was the minimum. The probability is 54% for 2013 and 27% for 2014: there really was a minimum around then.
The probability that the rate is higher in 2017 than in 2013 is over 90%. This one isn’t just random variation, and it isn’t population increase.
Update: Peter Ellis, who has more experience with NZ official statistics and with Bayesian state-space time series models, gets qualitatively similar results
Q: Did you see “Just one extra banana or avocado a day could prevent heart attacks and stroke”
A: Hmm.
Q: It’s the potassium
A: Uhuh
Q: New Research Suggests
A: The effects of higher-potassium foods on blood pressure aren’t ‘new research’. Look at what the American Heart Association says, or Harvard Health.
Q: Those sites don’t mention avocados, though. Is that what was new about the research?
A: No, that’s probably to meet the day’s quota for avocado stories.
Q: But at least the health message is real? They quote the researcher “The findings demonstrate the benefit of adequate potassium supplementation on prevention of vascular [hardening]”. With proper brackety things like we tell students to use.
A: We might prefer students to quote the rest of the clause , as the story does later: “demonstrate the benefit of adequate potassium supplementation on prevention of vascular calcification in atherosclerosis-prone mice” (emphasis added)
Q: So it probably wasn’t bananas, either.
A: No, high-cholesterol, high fat mouse food with high or low potassium.
Q: But the high-potassium mice lived longer? They had fewer heart attacks and strokes?
A: This is a lab experiment. It’s never going to end well for the mice. But they had stretchier arteries while they were alive.
Q: So what was the point, if we already knew higher-potassium diets with lots of fruit and veg are good for blood pressure?
A: The point was to find out how it works — which genes and proteins and so on.
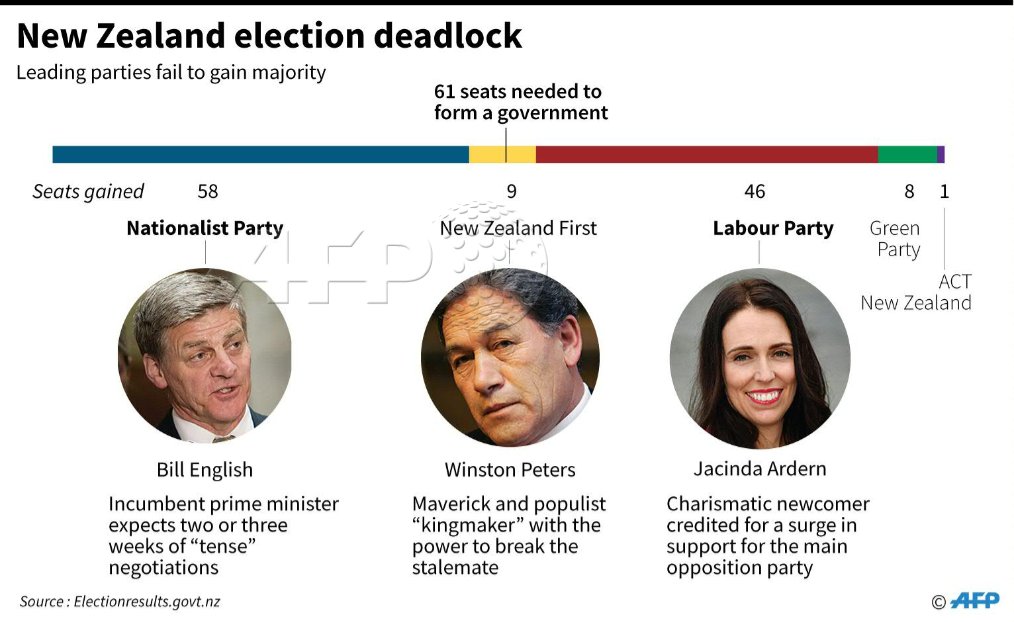
From the world’s third-largest news agency: