State caricatures
This map of most disproportionately consumed Thanksgiving side dishes, from 538, is circulating again
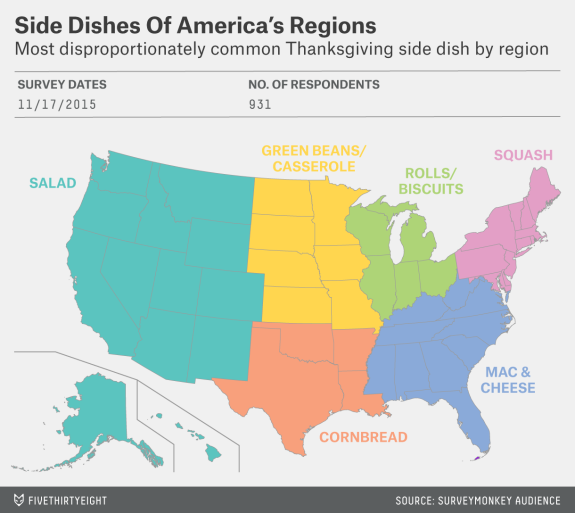
As I’ve pointed out before, these aren’t the most commonly eaten in each state, they’re the ones that are most different from the rest of the country — a sort of caricature of the nation’s food geography. It’s actually worse than that, since this is from a relatively small poll and didn’t even record what state people were in, just what region.
Since 538 makes their data available, we can do other maps. Here’s the most commonly consumed side-dish
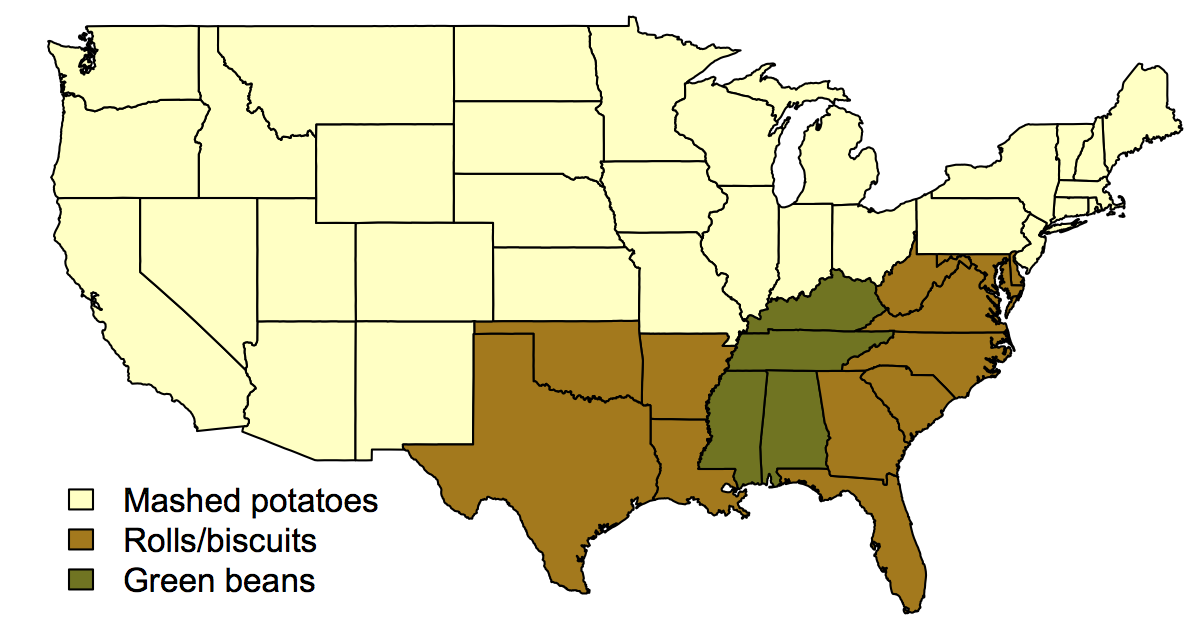
It’s much less interesting, but even this overstates the geographic variation.
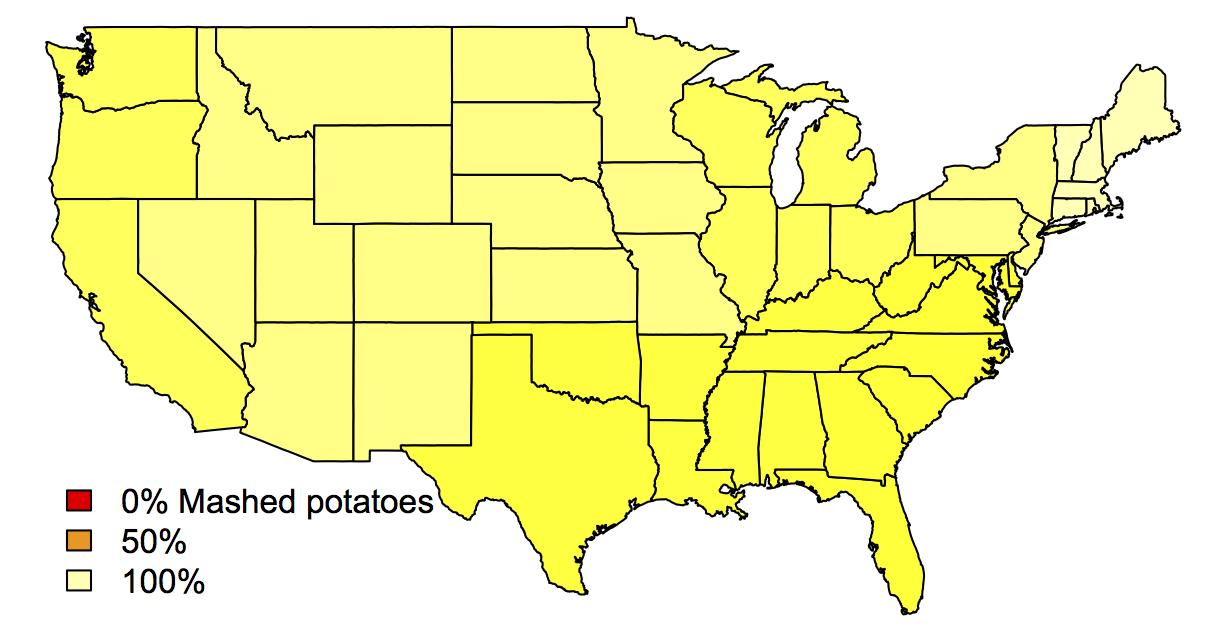
Here, on a red-to-yellow heat scale, is the proportion of respondents who have mashed potatoes
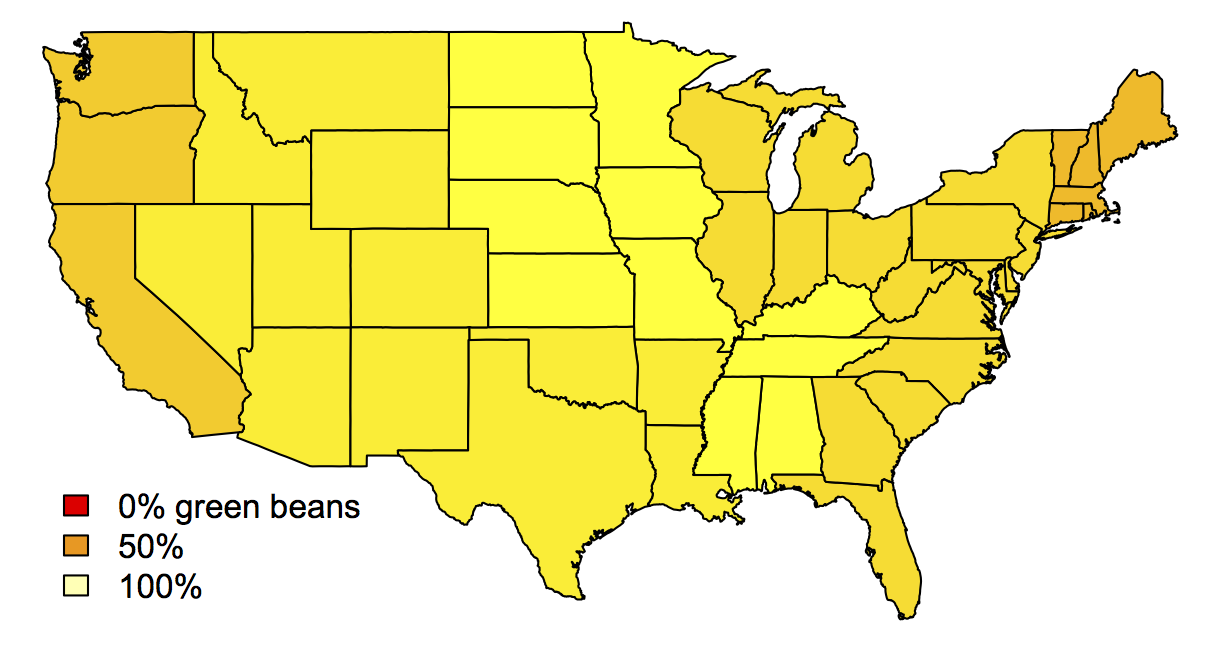
and green beans/green bean casserole
There’s nothing necessarily wrong with the ‘most disproportionate’ map, as long as you recognise what it’s doing. But saying, as 538 did, “When you get past the poultry and check out the side dishes, though, the regional distinctions really come out” tends to hide that point.
Thomas Lumley (@tslumley) is Professor of Biostatistics at the University of Auckland. His research interests include semiparametric models, survey sampling, statistical computing, foundations of statistics, and whatever methodological problems his medical collaborators come up with. He also blogs at Biased and Inefficient See all posts by Thomas Lumley »