Jenny Bryan @JennyBryan was one of several leading women in data science who attended this week’s joint conference of the New Zealand Statistical Association, the International Association of Statistical Computing (Asian Regional Section) and the Operations Research Society of New Zealand at the University of Auckland, 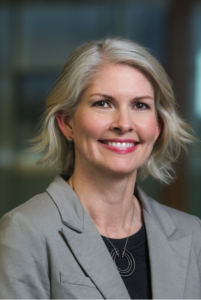 so we couldn’t miss the opportunity to talk with her (Jenny’s conference presentation, titled “Zen and the aRt of workflow maintenance”, is here). A brief bio: Jenny is a software engineer at RStudio while on leave from her role as Associate Professor in Statistics at the University of British Columbia, where she was a biostatistician. Jenny serves in leadership positions with rOpenSci and Forwards and is a member of The R Foundation. She takes special delight in eliminating the small agonies of data analysis.
Statschat: When did you first encounter statistics as a young person? Jenny: I was an economics major which had exactly one required statistics paper, which I took, and then continued to try and make that degree as un-quantitative as I possibly could. I had started out thinking I would major in some form of engineering, and therefore was taking math and physics and the technical track.
I was one of very few women in the course, and the culture of the course was to pull an all-nighter once a week [to do the weekly problem set]. The average mark on the exam would be 20 out of 100, and I was mentally not prepared for this type of sort of stamina-driven culture.
Was it a macho culture? That’s how it felt to me, and you needed enough innate confidence to never worry about the fact that you were getting marks you had never seen before in your life – everyone failed miserably all the time. After the first semester or two of this, I decided it wasn’t for me and declared my major to be German literature, which I saw through. But in the last two years at university, I realised I needed to be employable when I graduated, so I added economics as a means to making sure I could make a living later.
I worked as a management consultant for a couple of years and that’s where I learned that I was actually at my happiest when they locked in a room by myself with a huge spreadsheet and I had some data task ahead of me … and so then I gradually worked my way back to what I think I’m really good at.
Did you pursue statistics qualifications? I did. After my two years of management consulting, the normal track would be to be sent off to business school. But thanks to what I learned about myself, I was pretty sure that wasn’t the right track for me. But I had learned how to give talks, how to extract questions from people and go and make it quantitative and then translate my solution back into their language. So the management consulting experience was super-useful.
At that point, I had met my husband, and I followed him to his first postdoc with no particular plans. He’s a mathematician – he knew he wanted to be a mathematician when he was 6. I never had that kind of certainty about what I was meant to do! It took me a lot longer to figure it out.
So I followed him, and basically played a lot of tennis at first (laughs) while were living in Southern California … I decided some form of statistics would be ideal for me, but I didn’t have enough of a math background to take the specialised math exams in the US, called the GREs [Graduate Record Examinations] that a lot of statistics departments want to see. So I started taking as many prerequisites as I could at the university where he was doing his postdoc. I did well and started working as a teaching assistant in these classes as well.
Then we moved together, two years later, for him to start his second postdoc and for me to start biostatistics grad school. Also during this time, I supported myself doing fancy Excel work as a temp … so I did a PhD in Biostatistics at Berkeley in five years – the first two years are the masters, and three years of writing the thesis.
What’s your academic career path been since then? I got my job at University of British Columbia before I graduated, and I was there until I went on leave earlier this year. I’ve since been working in Hadley Wickham’s group at RStudio. My title is software engineer, which I still find a bit peculiar.
Why? Because I feel I should have more formal training in engineering to have that title, but I’m getting more comfortable with it.
What’s the essence of your role there? I spend about two-thirds of my effort on package development and package maintenance. Hadley is starting to gradually give maintainership of his packages to other people … so I took over readxl. I already had an existing line of work in making R talk to Google APIs [application programming interface], so I worked with an intern this summer and we created a package from scratch so that you can use Google Drive from R. Now I’m revisiting some general tools for authenticating with Google APIs, and I have another package that talks to Google spreadsheets. I also do quite a bit of talking and teaching.
You put a lot of your work on the internet. Why do you feel that is important to share it this way? I decided this was how I was going to interpret what it meant to be a scholar. Several years ago, I decided that teaching people about the process of data analysis was super-important to me, and was being completely undertaught, and I was going to dedicate a lot of my time to it. Luckily, I already had tenure at that point, but it still looks a bit like career suicide to make this decision, because it means that you’re not producing conventional statistical outputs like methodological papers. I also felt like putting my stuff out there and having a public course webpage and pushing things out would be my defence against [any suggestion] that I wasn’t doing anything.
You’re clearly not satisfied that the current academic system is serving the subject well. Not at all! We have a really outdated notion that only publications matter, and publications where there’s novel methodology. I think that’s leaving a ton of value on the table – making sure that statistical methods that exist are actually used, or used correctly. But the field is not set up to reward that – the majority of papers are not widely read and cited, and many of these methods are not used or implemented in any practical way …. it’s been enshrined that academic papers are what counts, but they’re not a directly consumable good by society. We need knowledge-translation activity as well.
So you’re rebelling. Well, I felt that the only way you could do it was to start doing the things you thought were valuable. Being able to put your course material online, to have a dialogue with people in your field on Twitter … you can finally remove a lot of these gatekeepers from your life. They can keep doing their thing, but I know people care and read this stuff. Since I was able to wait until I had security of employment, I decided that if that meant I didn’t go from associate to full [professor], I could live with that. It’s not that my department isn’t [supportive] – it’s either neutral or positive on all this. But it’s true that everyone else I was hired with is a full professor and I’m not.
Does that bug you? Yes and no. I think I could have pushed harder. But every time you push on these things, you’re basically asked, “Well, can you make what you do look more like a statistics publication? Each package that you write, can you write a stats paper around it?” and I’ve decided the answer is, “No. Can we agree that is not a helpful way to evaluate this work? The only reason to repackage it in that way is to check some box.”
Academics are becoming increasingly dissatisfied with academic publishing structures. Do you think that perhaps data scientists might take the lead in dismantling structures that aren’t helping the subject? Maybe, and I think things are changing. But I decided that it’s like turning the Titanic and it’s not going to happen on a time-scale consistent with my career. I can’t wait for academia to gradually reshape itself.
Is that one of the reasons you went off to RStudio? Oh, absolutely. I feel the things I do are tolerated in academia, and often found very useful, [but that said], I lost my grant funding the more applied I became. It’s harder to get promoted. You’re pressured to sell your work as something it’s not, just because that’s what the status quo rewards. Working at RStudio, I’m actually allowed to say what I do is what I do, and be proud of it, and be told that you are excellent at it, which is not currently possible in academic statistics.
So tell me about your typical day, working for RStudio. It’s a remote company. There is an office in Boston and a large enough group in Seattle that they rent a space, but the rest of us are on our own. So it’s just me alone at home working on my projects. We use Slack as a communication channel; the team I’m on maintains two channels for two separate groups of packages. We might have a group conversation going and it can be completely silent for three days, or we can have 100 messages in a morning. It really depends when someone raises an issue that other people care about, or can help out with. And then, I have private one-off conversations with Hadley or other members of the group, and similarly, they can be very quiet or suddenly light up.
Who do you live with? My husband’s a professor, so he’s mostly on campus but sometimes he’s around – we both like working at home and being alone together. The kids are all at home; they go to school from 9am until 3pm or 4pm. My oldest is 14 and I have twins who are about to turn 12.
So how do you manage work-life balance, given that you work from home? Well, I work when they are not there, then I try to work from 3pm to 6pm, or 4pm to 6pm, with mixed success, I would say. Then there are a couple of hours which are explicitly about driving people here and there. I do a second shift from 9pm to 1am or 2am.
Are you a night owl? Yeah, which I don’t love, but that’s just how things are in my life right now. I have to do it that way. I have one productive shift while the children are at school, then one productive shift after they go to bed.
Let’s talk about women in data science. I have the impression that maths remains male-dominated and that statistics is less so, but that data science appeals to women and that the numbers are quite good. What’s your take on that? The reason I liked statistics, and particularly liked applied statistics, is I was never drawn to math for maths’ sake, or the inherent beauty of math. I enjoyed doing it in the service of some other thing that I care about … I think it’s possible that there’s something about me that’s typical of other women, where having that external motivation is what makes you interested in, or willing to do, the math and the programming. For its own sake, it never really appealed to me that much. Programming appeals to me more on its own than math does. Programming actually can motivate me just because I love the orderliness of it and accomplishing these little concrete tasks – I love checking lists (laughs) and being able to check my work and know that it is correct … When you combine it with, “This is going to enable us to answer some question”, then it’s really irresistible.
So it’s the real-world nature of it that is really appealing to you. Yeah – I care about that a lot.
What skills and attributes make a good data scientist? I think being naturally curious, doing something for the sake of answering the question versus a “will-this-be-in-the-test?” mentality – just trying to do the minimum.
You need a huge tolerance for ambiguity. This is a quality I notice that we’re spending a lot of time on in our Master of Data Science programme at UBC. Half the students have worked before and about half are straight out of undergrad, and the questions they ask us are so different. The people straight out of undergrad school expect everything to be precisely formulated, and the people who’ve worked get it, that you’re never going to understand every last thing; you’re never going to be given totally explicit instructions. Figuring out what you should be doing is part of your job. So the sooner you develop this tolerance for ambiguity [the better] – that makes you very successful, instead of waiting around to be given an incredibly precise set of instructions. Part of your job is to make that set of instructions.
How much room for creativity is there in data science? I think there’s a ton. There’s almost never one right answer – there’s a large set of reasonable answers that reasonable people would agree are useful ways of looking at it. I think there’s huge scope to be creative. I also think being organised and pleased by order frequently makes this job more satisfying. People come to you with messy questions and messy data, and part of what you’re doing is this sort of data therapy, helping them organise their thoughts: “What is your actual question? Can the data you have actually answer that question? What’s the closest we can get?” Do that, then package it nicely, you do feel like you’ve reduced entropy! It feels really good.
You work from home and that suits you, but not every woman is able to do that. What needs to change to help women scientists’ progress through life and career, balancing what they need to balance? I don’t how specific this is to data science, but three things were helpful to me. One is I live in Canada, where we have serious maternity leave – you can take up to a year, and because that’s what the Government makes possible, that means it’s normal. In both cases, I took between six and nine months – I was begging to come back before a year! But having a humane amount of time for maternity leave is important.
Also, what’s typical in Canada, and what and UBC does, is that they pause any sort of career clock for a reasonable amount of time. So every time I went on maternity leave it added one year to my tenure clock.
You don’t end up out of synch with people who hadn’t been away. Yeah. It [parenthood] still slows your career down, but this helps immensely. So there are the structural policies.
Secondly, I do have a really supportive spouse. I feel like maybe I was lead parent when the kids were little, but since I made this career pivot and became much more interested in my work, he’s really taken the lead. I feel that there were many years where I was the primary parent organising the household, and now it’s really the other way around … that’s huge.
Third, I’m in my mid-late 40s now and I’m embarking on what feels to me like a second career; certainly, a second distinct part of my career and focusing more on software development. I think you also have to be willing to accept that women’s careers might unfold on a different time-scale. You might lose a few years in your 30s to having little kids … but you often find awards that are for people within five years of their PhD or for young investigators and they assume that you don’t have all this other stuff going on. I think another thing is [employers] being willing to realise that someone can still be effective, or haven’t reached their peak, in their 40s. The time-frame on which all of this happens needs to be adjusted. You need to be flexible about that.
Read more about Jenny Bryan:
Her academic page
A profile by rOpenSci.org

 so we couldn’t miss the opportunity to talk with her (Jenny’s conference presentation, titled “Zen and the aRt of workflow maintenance”, is