Posts from December 2020 (23)

December 15, 2020

New, improved Covid?

From Radio NZ

A new variant of coronavirus has been found which is growing faster in some parts of England, MPs have been told.

From the Herald (from the Telegraph)

A new variant of coronavirus has been identified in England and is spreading rapidly.

There is a sense in which this is true. The virus is spreading rapidly in southern England. And, because new mutations arise all the time and get passed on as the virus is spread, there is a new mutation that is more common in these new cases. However, there’s currently no evidence that there’s anything about this mutation that affects the spread of the virus at all.

Over the year,  thousands of genetic variants have been seen in the coronavirus (a paper a few weeks ago looks at 12000).  Some of these have become common, and so  might possibly  be better at spreading  Some mutations have arisen more than once and so might possibly be better at spreading. Mostly, though, variants have become common because they’ve found themselves in favorable circumstances — in people who don’t wear masks, or people who live in crowded situations, or people who go to church and sing, or who attend motorcycle rallies, or whatever. These variants are common because they won the lottery, not because they worked smarter and harder or had a #8-wire can-do attitude.  And, to be fair, the stories do later go on to admit this, or at least raise it as a contrasting view.

So far, there is one variant, called D614G, with reasonable (though not overwhelming) evidence that it makes a bit of difference to coronavirus transmission.  For example, a recent paper on it says

Although evidence is still accumulating, the increasing predominance of D614G in humans raises the possibility that viruses with this mutation have a fitness advantage, perhaps allowing more efficient person-to-person transmission. Our virological data are consistent with, but do not themselves demonstrate, this hypothesis. Interestingly, this mutation does not appear to significantly impact disease severity

In contrast, the Herald, (from news.com.au) back in July wrote about the D614G variant

The worst fears of epidemiologists have been realised: Covid-19 has mutated, and the strain now dominating the world is up to six times more infectious.

Fortunately, it wasn’t anything like six times more infectious.  This new one probably won’t amount to much either, though the people who look at Covid genomics will keep track of it like they do with all the other variants.


Update: useful Twitter thread for people who want nerdy details.

December 10, 2020

Rugby Predictions for the Weekend of December 19-20

I will be out of internet contact, even without a computer until Wednesday December 16 so I won’t be able to follow my usual practice of posting predictions on a Tuesday.  This only affects predictions for the Currie Cup as it happens.

I expect to post predictions for Round 4 of the Currie Cup either late on December 16 or on the morning of December 17, New Zealand time.

December 9, 2020

Election hypothesis testing

As you may have heard, there are people who are unhappy that Joe Biden is president-elect and think the courts should do something. In today’s most statistically interesting lawsuit, Texas is suing Georgia, Michigan, Pennsylvania, and Wisconsin, asking the Supreme Court to overturn their election results.  Legal Twitter does not appear convinced (on legal grounds).

There’s also a Declaration from an Expert arguing that the results are statistically impossible without fraud. This is statistics, so we can look at some of it here. It’s straightforward hypothesis testing, of the type we teach in high school.

Starting on paragraph 10, he’s looking at votes in Georgia and doing hypothesis tests on binary data. The tests being done are

  1. Comparing the total number of votes for Joe Biden with the total number of votes for Hillary Clinton in 2016
  2. Comparing the proportion of votes for Joe Biden (as a fraction of the 2020 vote) with the proportion of votes for Hillary Clinton (as a fraction of the 2016 vote)
  3. Comparing the proportion of votes for Biden (vs Trump) in ballots counted before and after 3:10am on election night

In all three cases, he finds very strong evidence that the two groups being compared are more different than if they were sampled independently from the same probability distribution.  The idea is that while massive undetected fraud is unlikely, if the observed data are even more unlikely we need to consider fraud as an explanation.  Clearly, this only makes sense if the mathematical null hypothesis being tested really would be unlikely in the absence of fraud.

Straw-man null hypotheses can be a problem in science: people will set up a null hypothesis that there’s no difference (or no important difference) between  two groups, even when no reasonable person would have entertained the possibility that the groups are the same, and the real question is how much they differ.   This election analysis has the same problem.

In test 1, we know that 2016 was four years ago, so the population has grown. We also know turnout was higher all over the US, including in states/counties/precincts won by Trump. For example, in Texas (where Texas is not seeking to overturn the results), 8.56 million people voted for Trump or Clinton in 2016 and 11.15 million voted for Trump or Biden in 2020.  The null hypothesis never had any reasonable chance of being true; finding that it actually is false is not surprising and provides no motivation for considering more esoteric explanations.

In test 2, the overall turnout and population change are taken into account.  A difference between Biden and Clinton’s percentage would be hard to explain unless Biden were actually more popular than Clinton with Georgia voters.  There are at least two reasons this would not be astonishing. Biden is more popular generally, and he’s specifically more popular with Black voters, who are making up an increasing fraction of the Georgia population. So, finding that Biden was more popular than Clinton with Georgia voters is not surprising, and provides no motivation for considering more esoteric explanations.

In test 3, the comparison is between votes counted earlier and votes counted later than 3:10am.  The statistical test provides strong evidence that votes counted early had different preferences from those counted later.  This would be surprising if you’d expect the two sets of votes to be identical — eg, if you mixed all the ballots together and counted them in random order. It turns out that this is not what happened.  The early votes were primarily those cast on election day; the later votes primarily those cast in advance.  The statistical test provides strong evidence that people voting in person on election day were different from those voting in advance. Again, this is not remotely surprising given the different perspectives on the pandemic offered by the two campaigns.

There are actually some technical problems with the statistical testing, but these pale in comparison to the problem of not testing hypotheses that have any real bearing on the fraud question.  It’s hardly worth mentioning the technical problems, except that this is a statistics blog.   The analysis treats the  votes in each comparison as independent observations. In fact, the comparison in test 3 will be subject to clumping: groups of people will affect each others voting preferences, and the percentages will have more variability than if they were from five million independent coin tosses. The evidence (against the straw-man null hypothesis) will be weaker than you’d compute from a model of independent coin tosses.

In tests 1 and 2 there will be this clumping, but in the other direction there’s the problem that the 2016 and 2020 votes are mostly from the same people.  If you asked people their vote today and tomorrow you’d expect the same answer from most people. If you asked in 2016 and 2020 the concordance would be weaker, but you’d expect it to still be there.  So, the statistical test would not actually be valid even for the straw-man null hypotheses, but it’s hard to say precisely how misleading it would be.

Vaccine data

The FDA has released its briefing document and Pfizer’s briefing document for their external advisory committee meeting on Friday.  Lots and lots of lovely detail.

Useful summaries and interpretations (I’ll add more as I come across them):

You can watch the FDA advisory committee meeting, from 4am to 1pm Friday morning NZ time, and I assume there will be a recording available afterwards. It will be very boring, but transparency is like that.


PS: there is also a new publication from the Oxford group about some of the Oxford/AstraZeneca trials. It’s not really going to make anyone happy.

PPS: Next week, the FDA does the Moderna vaccine, but that’s less interesting for NZ since we didn’t buy any.

December 8, 2020

Top 14 Predictions for Postponed Games

Team Ratings for Postponed Games

The basic method is described on my Department home page.
Here are the team ratings prior to this week’s games, along with the ratings at the start of the season.

Current Rating Rating at Season Start Difference
Racing-Metro 92 6.73 6.21 0.50
Stade Toulousain 5.63 4.80 0.80
Lyon Rugby 5.31 5.61 -0.30
La Rochelle 4.72 2.32 2.40
Clermont Auvergne 4.54 3.22 1.30
RC Toulonnais 3.39 3.56 -0.20
Bordeaux-Begles 2.77 2.83 -0.10
Montpellier 2.26 2.30 -0.00
Stade Francais Paris -0.16 -3.22 3.10
Castres Olympique -2.21 -0.47 -1.70
Section Paloise -3.37 -4.48 1.10
Brive -3.98 -3.26 -0.70
Aviron Bayonnais -4.85 -4.13 -0.70
SU Agen -10.22 -4.72 -5.50


Performance So Far

So far there have been 70 matches played, 48 of which were correctly predicted, a success rate of 68.6%.
Here are the predictions for last week’s games.

Game Date Score Prediction Correct
1 Aviron Bayonnais vs. Stade Toulousain Dec 05 20 – 24 -5.10 TRUE
2 Bordeaux-Begles vs. Racing-Metro 92 Dec 05 12 – 17 2.60 FALSE
3 Clermont Auvergne vs. Montpellier Dec 05 15 – 21 8.80 FALSE
4 Lyon Rugby vs. La Rochelle Dec 05 22 – 18 6.40 TRUE
5 Section Paloise vs. Castres Olympique Dec 05 13 – 17 5.10 FALSE
6 Stade Francais Paris vs. RC Toulonnais Dec 05 24 – 23 2.10 TRUE
7 SU Agen vs. Brive Dec 05 6 – 15 -0.00 TRUE


Predictions for Postponed Games

Here are the predictions for Postponed Games. The prediction is my estimated expected points difference with a positive margin being a win to the home team, and a negative margin a win to the away team.

Game Date Winner Prediction
1 Castres Olympique vs. Brive Dec 23 Castres Olympique 7.30


Rugby Premiership Predictions for Round 4

Team Ratings for Round 4

The basic method is described on my Department home page.
Here are the team ratings prior to this week’s games, along with the ratings at the start of the season.

Current Rating Rating at Season Start Difference
Exeter Chiefs 10.47 7.35 3.10
Sale Sharks 4.22 4.96 -0.70
Wasps 3.01 5.66 -2.70
Bristol 1.43 1.28 0.10
Bath 0.50 2.14 -1.60
Harlequins -0.37 -1.08 0.70
Gloucester -1.99 -1.02 -1.00
Northampton Saints -2.95 -2.48 -0.50
Leicester Tigers -6.21 -6.14 -0.10
Newcastle Falcons -6.89 -10.00 3.10
Worcester Warriors -7.15 -5.71 -1.40
London Irish -7.17 -8.05 0.90


Performance So Far

So far there have been 18 matches played, 11 of which were correctly predicted, a success rate of 61.1%.
Here are the predictions for last week’s games.

Game Date Score Prediction Correct
1 Bristol vs. Northampton Saints Dec 05 18 – 17 9.90 TRUE
2 Leicester Tigers vs. Exeter Chiefs Dec 06 13 – 35 -10.90 TRUE
3 Wasps vs. Newcastle Falcons Dec 06 17 – 27 17.00 FALSE
4 Worcester Warriors vs. Bath Dec 06 17 – 33 -1.60 TRUE
5 London Irish vs. Sale Sharks Dec 07 13 – 21 -6.70 TRUE
6 Gloucester vs. Harlequins Dec 07 24 – 34 4.40 FALSE


Predictions for Round 4

Here are the predictions for Round 4. The prediction is my estimated expected points difference with a positive margin being a win to the home team, and a negative margin a win to the away team.

Game Date Winner Prediction
1 Bath vs. London Irish Dec 27 Bath 12.20
2 Harlequins vs. Bristol Dec 27 Harlequins 2.70
3 Newcastle Falcons vs. Leicester Tigers Dec 27 Newcastle Falcons 3.80
4 Exeter Chiefs vs. Gloucester Dec 27 Exeter Chiefs 17.00
5 Northampton Saints vs. Worcester Warriors Dec 27 Northampton Saints 8.70
6 Sale Sharks vs. Wasps Dec 28 Sale Sharks 5.70


Pro14 Predictions for Round 9

Team Ratings for Round 9

The basic method is described on my Department home page.
Here are the team ratings prior to this week’s games, along with the ratings at the start of the season.

Current Rating Rating at Season Start Difference
Leinster 19.39 16.52 2.90
Munster 10.26 9.90 0.40
Ulster 7.88 4.58 3.30
Edinburgh 3.72 5.49 -1.80
Glasgow Warriors 3.12 5.66 -2.50
Scarlets 1.88 1.98 -0.10
Connacht 1.04 0.70 0.30
Cardiff Blues -0.41 0.08 -0.50
Cheetahs -0.46 -0.46 0.00
Ospreys -3.25 -2.82 -0.40
Treviso -4.26 -3.50 -0.80
Dragons -7.28 -7.85 0.60
Southern Kings -14.92 -14.92 0.00
Zebre -16.71 -15.37 -1.30


Performance So Far

So far there have been 43 matches played, 29 of which were correctly predicted, a success rate of 67.4%.
Here are the predictions for last week’s games.

Game Date Score Prediction Correct
1 Connacht vs. Treviso Dec 05 31 – 24 11.50 TRUE
2 Glasgow Warriors vs. Dragons Dec 06 22 – 23 19.10 FALSE


Predictions for Round 9

Here are the predictions for Round 9. The prediction is my estimated expected points difference with a positive margin being a win to the home team, and a negative margin a win to the away team.

Game Date Winner Prediction
1 Connacht vs. Ulster Dec 27 Ulster -1.80
2 Dragons vs. Cardiff Blues Dec 27 Cardiff Blues -1.90
3 Glasgow Warriors vs. Edinburgh Dec 27 Glasgow Warriors 4.40
4 Munster vs. Leinster Dec 27 Leinster -4.10
5 Ospreys vs. Scarlets Dec 27 Scarlets -0.10
6 Zebre vs. Treviso Dec 27 Treviso -7.50


Currie Cup Predictions for Round 3

Team Ratings for Round 3

The basic method is described on my Department home page.
Here are the team ratings prior to this week’s games, along with the ratings at the start of the season.

Note that Cheetahs2 refers to the Cheetahs team when there is a Pro14 match. The assumption is that the team playing in the Pro14 is the top team and the Currie Cup team is essentially a second team. Possibly there will be no such clashes this year

Current Rating Rating at Season Start Difference
Bulls 7.56 6.16 1.40
Sharks 6.86 5.63 1.20
Western Province 4.57 5.26 -0.70
Lions 1.39 1.46 -0.10
Cheetahs -3.86 -2.96 -0.90
Pumas -7.91 -6.66 -1.20
Griquas -8.62 -8.90 0.30


Performance So Far

So far there have been 6 matches played, 5 of which were correctly predicted, a success rate of 83.3%.
Here are the predictions for last week’s games.

Game Date Score Prediction Correct
1 Pumas vs. Griquas Dec 04 22 – 17 5.30 TRUE
2 Bulls vs. Cheetahs Dec 05 40 – 13 14.10 TRUE
3 Lions vs. Western Province Dec 05 22 – 19 0.90 TRUE


Predictions for Round 3

Here are the predictions for Round 3. The prediction is my estimated expected points difference with a positive margin being a win to the home team, and a negative margin a win to the away team.

Game Date Winner Prediction
1 Western Province vs. Pumas Dec 11 Western Province 17.00
2 Cheetahs vs. Lions Dec 12 Lions -0.70
3 Sharks vs. Bulls Dec 12 Sharks 3.80


December 7, 2020

Vaccine effects and effectiveness: fair comparisons

Thinking about vaccine effectiveness is tricky, but Senator Rand Paul has a medical degree so he has no excuse

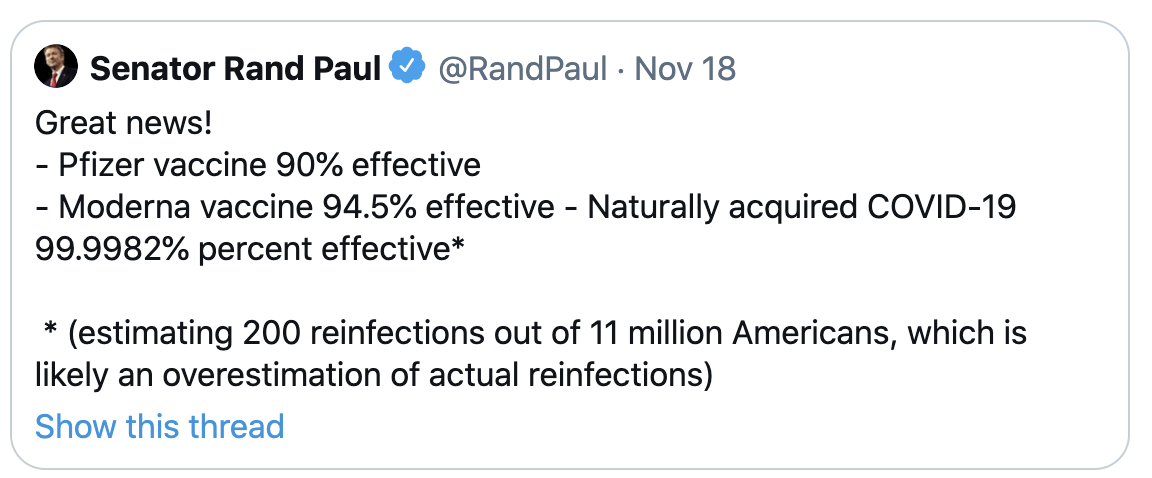
The Pfizer vaccine had seen 8 Covid cases in 22,000 people vaccinated.  If the way you computed vaccine effectiveness was to divide the number of infections by the number exposed, the way Paul has done for ‘naturally acquired Covid-19’, the effectiveness would be 21992/22000= 99.96%. Sounds pretty good!

On the other hand, if that was the way you computed effectiveness then just being in the US would be 95% effective — more than 95% of people in the US have yet to get Covid.  As being in the US increases your risk of Covid, we can be sure this isn’t the right way to do the computation.

Vaccine effectiveness requires a fair comparison between two groups: one group who gets the vaccine and one group who doesn’t.   We do this with randomised trials because it’s really hard to be confident about fair comparisons any other way.   When we say the Pfizer and Moderna vaccines are 95% effective in preventing symptomatic Covid-19, we mean that the proportion of people getting symptomatic Covid-19 in the vaccine group was 95% lower than the proportion in the placebo group.

There’s currently no real basis for saying immunity based on infection is higher or lower than immunity based on vaccine (except for the trivial point that getting Covid naturally is 0% effective as a way of not getting Covid at all). It’s a hard problem.

We obviously can’t randomise people to having had ‘naturally acquired’ Covid-19 infection. What we’d need to do to estimate the effectiveness is find large groups of comparable people who were and weren’t infected back earlier this year, make sure we gave these groups the same risks of exposure to Covid-19 and the opportunities to get tested, and count the number of new cases.   So, we’d need to find some region that had very high rates of infection back in February/March, with reliable testing, and that has very high rates again now, again with reliable testing.  You couldn’t do this study in the US, because infection rates are currently high in different parts of the country from the first wave. You couldn’t do it in Wuhan, because rates there are low. Sadly, it looks like there is one candidate region, Lombardy in northern Italy, but they have other priorities right at the moment.

Because we don’t have direct comparative evidence on natural immunity, we’ve only managed to do two sorts of analysis. First, by looking at people who have had two sets of viral genome sequencing, we can be 100% sure that some people get reinfected. Second, by looking at immune responses of people infected early in the pandemic, we know that the biochemical markers of immunity are looking pretty stable out as far as we have data, which is only six months or so.

The same sort of problem happens for vaccine adverse reactions.  First, an important distinction: adverse events are bad things that happen after you got the vaccine; adverse reactions or adverse effects are bad things that happen because you got the vaccine.  You can observe adverse events; adverse reactions are a theoretical explanation.

In randomised trials, we know the people who did and didn’t get the vaccine were otherwise comparable, so we do know that any big differences in adverse events must be caused by the vaccine — they are adverse reactions.  The Covid vaccines have a high rate of mild to moderate short-term adverse reactions (including pain at the injection site, fatigue, fever, chills).  These only last a short time, and they are better than Covid, but they are not trivial.   There are also small numbers of serious adverse events in the trials, and we’ll hear more about the extent to which these are likely to be caused by the virus. Because so many people were in the trials, we know that any adverse reactions we haven’t seen in the trials must be rare (or long term). Against all of that, we know there are serious medical, social, and economic effects of not ending the pandemic, even here in relatively-secure New Zealand.

However, when we start vaccinating people there will be lots of other adverse events, because there are always adverse events.  If you gave a placebo injection to everyone in New Zealand there would be about 25,000 new cases of cancer over the following year — because 25,000 new cases of cancer is what happens in a typical year in New Zealand.  About 5800 people would die of heart disease, because 5800 people dying of heart disease is what happens in a typical year in New Zealand. About 140 people would be diagnosed with motor neurone disease and maybe 60 with Guillain-Barré syndrome, again, because that’s what happens in a normal year. If you give a vaccine injection to everyone in New Zealand, then on top of any real effects of the vaccine, the same things will happen, and some of them will look as though they are caused by the vaccine. Many of these would make good stories, and I’d hope the media will be careful what they do with them.

The best bet for distinguishing adverse reactions from adverse events that would have happened anyway is careful statistical analysis of big medical databases here (through the Centre for Adverse Reactions Monitoring) and even bigger ones in the US (the Sentinel Initiative), but even there it will be hard to tell whether a moderately higher rate of a rare event next year is coincidence or a side effect.  It’s quite possible that there will be real, rare vaccine effects, and we can be absolutely sure there will be spurious apparent vaccine effects.

December 1, 2020

Currie Cup Predictions for Round 2

Team Ratings for Round 2

The basic method is described on my Department home page.
Here are the team ratings prior to this week’s games, along with the ratings at the start of the season.

Current Rating Rating at Season Start Difference
Sharks 6.86 5.63 1.20
Bulls 6.67 6.16 0.50
Western Province 4.76 5.26 -0.50
Lions 1.21 1.46 -0.30
Cheetahs -2.96 -2.96 -0.00
Pumas -7.89 -6.66 -1.20
Griquas -8.64 -8.90 0.30


Performance So Far

So far there have been 3 matches played, 2 of which were correctly predicted, a success rate of 66.7%.
Here are the predictions for last week’s games.

Game Date Score Prediction Correct
1 Sharks vs. Pumas Nov 27 45 – 10 16.80 TRUE
2 Griquas vs. Lions Nov 28 17 – 20 -5.90 TRUE
3 Western Province vs. Bulls Nov 28 20 – 22 3.60 FALSE


Predictions for Round 2

Here are the predictions for Round 2. The prediction is my estimated expected points difference with a positive margin being a win to the home team, and a negative margin a win to the away team.

Game Date Winner Prediction
1 Pumas vs. Griquas Dec 04 Pumas 5.30
2 Bulls vs. Cheetahs Dec 05 Bulls 14.10
3 Lions vs. Western Province Dec 05 Lions 0.90