Cancer and weed?
Q: Did you see a study has found cannabis causes more cancers than tobacco?
A: Sigh. That’s not what it says
Q: Otago Daily Times: Study finds cannabis causes more cancers than tobacco
A: Read a bit further
Q: “shows cannabis is causal in 27 cancers, against 14 cancers for tobacco”. So it’s just saying cannabis is involved in causing more different types of cancer than tobacco? Nothing about more actual cases of cancer.
A: Yes, and if you’re not too fussy about “causes”
Q: Mice?
A: No, people. Well, not people exactly. States. The study had drug-use data averaged over each year in each US state, from a high-quality national survey, and yearly state cancer rates from SEER, which collects cancer data, and correlated one with the other.
Q: Ok, that makes sense. It doesn’t sound ideal, but it might tell us something. So I’m assuming the states with more cannabis use had more cancer, and this was specific to cannabis rather than a general association with drug use?
A: Not quite. They claim the states and years where people used more cannabidiol had higher prostate and ovarian cancer rates — but the states and years where people used more THC had lower rates.
Q: Wait, the drug-use survey asked people about the chemical composition of their weed? That doesn’t sound like a good idea. What were they smoking?
A: No, the chemical composition data came from analyses of illegal drugs seized by police.
Q: Isn’t the concern in the ODT story about legal weed? <reading noises> And in the research paper? Is that going to have the same trends in composition across states
A: Yes. And yes. And likely no.
Q: So their argument is that cannabidiol consumption is going up because of legalisation and prostate cancer is going up and this relationship is causal
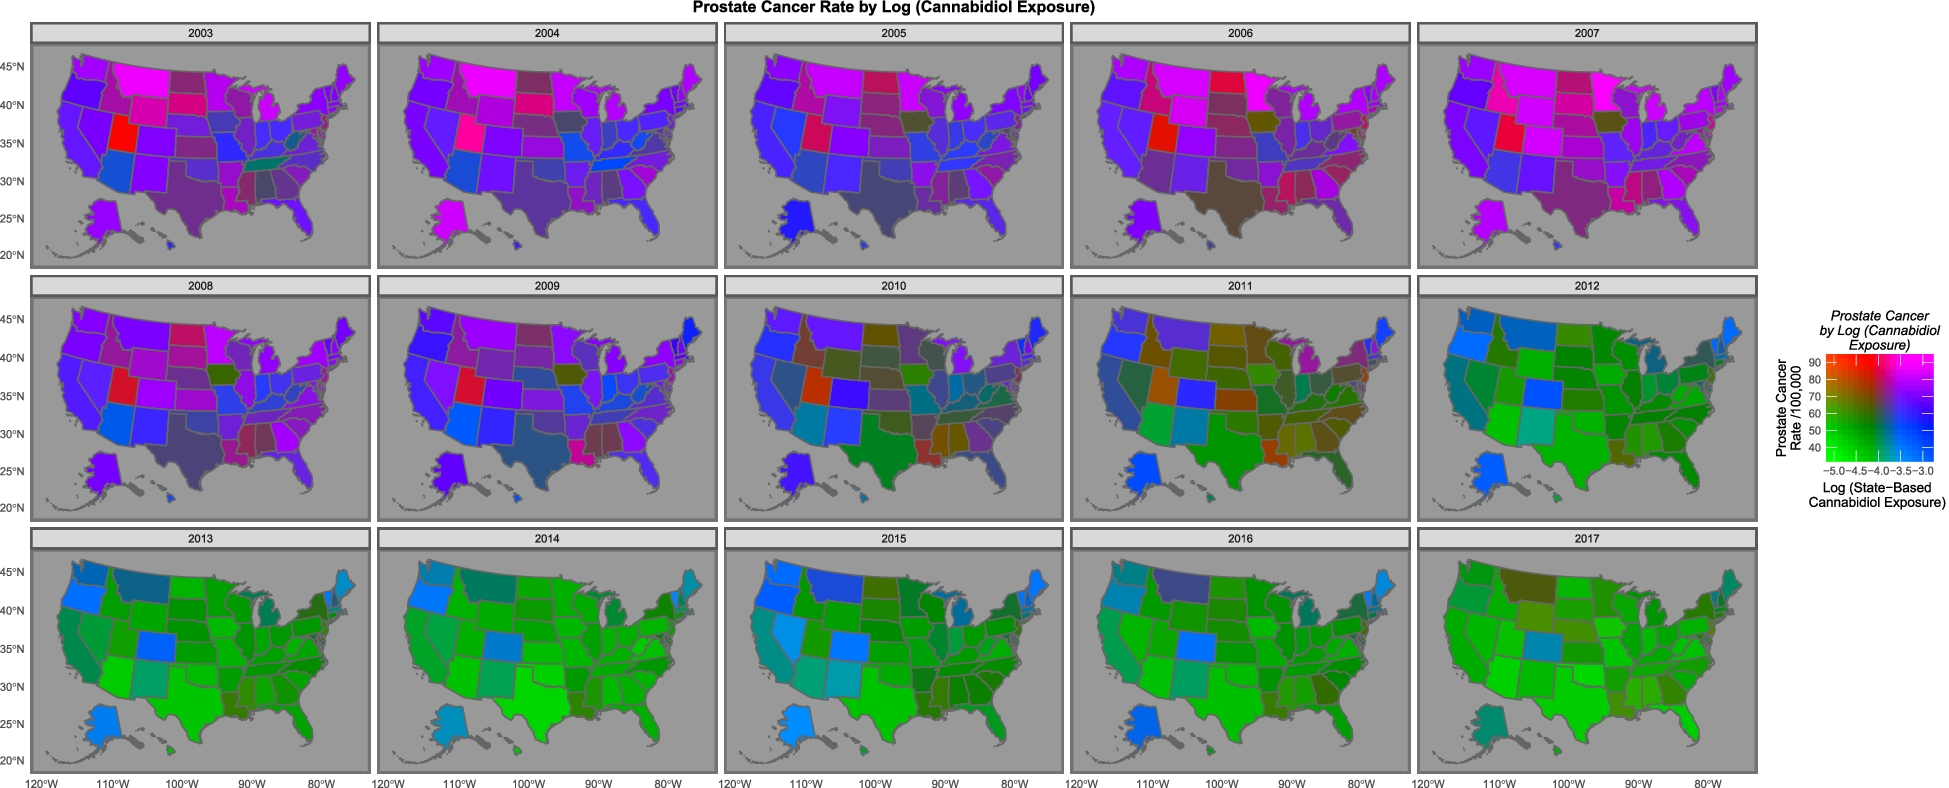
A: No, that was sort of their argument in a previous study looking at cancer in kids, which is going up while cannabis use is going up. Here, they argue that ovarian and prostate cancer are going down while cannabidiol use is going down. And that it’s happening in the same states. In this map they say that the states are basically either purple (high cancer and high cannabidiol) or green (low both) rather than red or blue
Q: Um.
A: “The purple and pink tones show where both cannabidiol and prostate cancer are high. One notes that as both fall the map changes to green where both are low, with the sole exception of Maine, Vermont and New Hampshire which remain persistently elevated.”
Q: What’s the blue square near the middle, with high weed and low cancer?
A: Colorado, which had one of the early legalisation initiatives.
Q: Isn’t the green:purple thing mostly an overall trend across time rather than a difference between states?
A: That would be my view, too.
Q: How long do they say it takes for cannabis to cause prostate cancer? Would you expect the effect to show up over a period of a few years?
A: It does seem a very short time, but that’s all they could do with their data.
Q: And, um, age? It’s older men who get prostate cancer mostly, but they aren’t the ones you think of as smoking the most weed
A: Yes, the drug-use survey says cannabis use is more common in young adults, a very different age range from the prostate cancer. So if there’s a wave of cancer caused by cannabis legalisation it probably won’t have shown up yet.
Q: Ok, so these E-values that are supposed to show causality. How do they find 20,000,000,000,000,000,000,000,000,000,000,000,000,000,000,000,000,000,000,000,000,000,000,000,000,000,000,000,000,000,000,000,000,000,000,000,000,000,000,000,000,000 times stronger evidence for causality with cannabis, not even using any data on individuals, than people have found with tobacco?
A: It’s not supposed to be strength of evidence, but yes, that’s an implausibly large number. It’s claiming any other confounding variable that explained the relationship would have to have an association that strong with both cancer and cannabidiol. Which is obviously wrong somehow. I mean, we know a lot of the overall decline is driven by changes in prostate screening, and that’s not a two bazillion-fold change in risk.
Q: But how could it be wrong by so much?
A: Looking at the prostate cancer and ovarian cancer code file available with their paper, I think they’ve got the computation wrong, in two ways. First, they’re using the code default of a 1-unit difference in exposure when their polynomial models have transformed the data so the whole range is very much less than one. Second, the models with the very large E-values in prostate cancer and ovarian cancer are models for a predicted cancer rate as a function of percentile (checking for non-linear relationships), rather than models for observed cancer as a function of cannabidiol.
Q: They cite a lot of biological evidence as reasons to believe that cannabinoids could cause cancer.
A: Yes, and for all I know that could be true; it’s not my field. But the associations in these two papers aren’t convincing — and certainly aren’t 1.92×10125-hyper-mega-convincing.
Q: Russell Brown says that the authors are known anti-drug campaigners. But should that make any difference to getting the analysis published? They include their data and code and, you know, Science and Reproducibility and so on?
A: Their political and social views shouldn’t make any difference to getting their analysis published in Archives of Public Health. But it absolutely should make a difference to getting their claims published by the Otago Daily Times without any independent expert comment. There are media stories where the reporter is saying “Here are the facts; you decide”. There are others where the reporter is saying “I’ve seen the evidence, trust me on this”. This isn’t either of those. The reporter isn’t certifying the content and there’s no way for the typical reader to do so; an independent expert is important.
Thomas Lumley (@tslumley) is Professor of Biostatistics at the University of Auckland. His research interests include semiparametric models, survey sampling, statistical computing, foundations of statistics, and whatever methodological problems his medical collaborators come up with. He also blogs at Biased and Inefficient See all posts by Thomas Lumley »
I almost feel like this is a bit kind to the authors, although perhaps appropriately so given the size of your platform. I worry about statements like:
“It is therefore potentially susceptible to the short-comings typical of ecological studies including the ecological fallacy and selection and information biases. Within the present paper we began to address these issues with the use of E-values in all Tables.”
Which seems to imply that E-values could be of some use for selection bias, information bias, and the ecological fallacy.
Tyler VanderWeele defines the E-value as:
“The E-value is defined as the minimum strength of association, on the risk ratio scale, that an unmeasured confounder would need to have with both the treatment and the outcome to fully explain away a specific treatment-outcome association, conditional on the measured covariates.” (https://pubmed.ncbi.nlm.nih.gov/28693043/)
None of this reflects on the other types of bias and I am unaware of such a claim. This makes me worried about the use of E-values if they are going to reduce concern about other types of bias. They are also not really evidence of causality so much as a measure of how much confounding would be needed to explain a result. Obviously such confounding could be present.
I also think that the relative risks in Table 6 are alarming, likely for the reasons you identified from the code. They are equally implausible as the E-values if relative risk has a conventional definition. Relative is not mentioned in the paper (except in the tables) but a conventional interpretation would make Dr. Doll’s RR 16 for smoking and lung cancer seem paltry by comparison.
In any case, thank you for the public service of pointing this paper out. It is a good cautionary tale. I can at least applaud all of the data and materials being public, which enables a robust discussion of what is being seen.
4 years ago
I basically agree with you, it’s mostly that this isn’t the right place for me to explain a lot of the statistical background. If I were going to do *that* post (which I might) it would be on my blog, as with the mice/autism study.
4 years ago
PS: the code doesn’t actually run in a clean installation — it loads intermediate files created during the analysis, from absolute paths. I think it’s probably editable to run with a bit of effort and the E-value computations are stand-alone. But it’s not uncommon for reproducible code to take some work to actually reproduce, and they have made an effort there.
4 years ago
This always makes me sad because the authors were trying (I have almost never published my code and it scares me every time). I wish that they had managed to acquire some additional assistance. If you read the peer reviews they include this comment:
“I have to admit I don’t feel competent to fully evaluate the methods and results of this study. I am not familiar with the statistical techniques which have been used and my knowledge about genetics is insufficient to assess the quality of the work that has been done by the authors.”
Which makes me wish that they’d been paired with a statistical reviewer because things could have been improved.
4 years ago
There’s something odd here in hierarchy of evidence terms – there’s already been prospective cohort evidence showing pot isn’t associated with cancers except testicular cancers which are fortunately rare, and is associated with metabolic benefits (which would reasonably be expected to decrease risk of common cancers over longer terms but anyway)
Those studies actually take data from users and non-user controls – they are far more focused than this, which cannot separate the two categories.
To go from that evidence to an ecological study, which is very low hierarchy, reverses the usual progress of epidemiology.
It’s reasonable to think that any study powerful enough to detect an increased risk of a rare cancer like testicular cancer, or any other finding already in those papers, would already have picked up an increased risk of prostate cancer, which is a very common cancer indeed.
4 years ago
Yes, indeed. I think there are potential exceptions to the hierarchy in settings where population exposure measurement is much more accurate than individual exposure measurement — Ross Prentice has argued this for dietary data — but that’s definitely not the case here.
4 years ago