Posts written by James Curran (32)

avatar

James Curran's interests are in statistical problems in forensic science. He consults with forensic agencies in New Zealand, Australia, the United Kingdom, and the United States. He produces and maintains expert systems software for the interpretation of evidence. He has experience as an expert witness in DNA and glass evidence, appearing in courts in the United States and Australia. He has very strong interests in statistical computing, and in automation projects.

July 31, 2013

“10 quadrillion times more likely to have done it”

Thomas Lumley, tipped off by Luis Apiolaza on Twitter, pointed me to this article in the NZ Herald.

The article is yet another example of the Herald’s inability to correctly report DNA statistics. It makes the following statement:
This article reports a quote from the Crown Prosecutor, paraphrased as follows:

A man charged with raping a woman during a kidnap has pleaded not guilty but Crown says DNA evidence shows the man was “10,000,000,000,000,000 times likely” to be responsible for the crime.

To be fair to the article’s author, this may have been the statement that the Crown prosecutor made, but nNo forensic scientist in New Zealand would say this. ESR scientists are trained to give statements of the following type:

“The evidence is 1016 (=10,000,000,000,000,000) times more likely if the defendant and the victim were contributors to the stain, rather than the victim and someone unrelated to the defendant.”

It is extremely important to note that This is a statement about the likelihood of the evidence given the hypotheses rather than the other way around. A forensic scientist is bought to court to comment on the strength of the evidence and specifically not on whether the defendant is guilty.

I have commented on this before., and sent correspondence to the NZ Herald numerous times. Perhaps a mention on StatsChat will inspire change.

Update: The NZ Herald reporter, James Ihaka, has contacted me and said “The statement came from a Crown prosecutor about the evidence that the forensic scientist will present later in the trial. Taking in to consideration what you have said however, it would probably be more accurate to rephrase this.” Good on you James!

Update 2: James Ihaka has contacted me again, with the following information:

This is the direct quote from Crown prosecutor Rebecca Mann: ( I checked with her)
“It is ten thousand million million times more likely for the DNA these samples originated from (the complainant) and Mr Martin rather than from (the complainant) and another unrelated individual selected at random from the general New Zealand population.”
I apologize unreservedly for attributing this to James Ihaka, and again congratulate him for following it up.

The statement Ms. Mann should have given is


The evidence (the DNA match) is ten thousand million million times more likely if these samples originated from (the complainant) and Mr Martin rather than if they originated from (the complainant) and another unrelated individual selected at random from the general New Zealand population.”

May 17, 2013

How do you get a career in statistics?

This is a common question from our students. Unfortunately our perspective does not always lend itself easily to life outside of research and academia, as what I look for in a curriculum vitae and in a job interview is usually with respect to hiring someone who will become an academic staff member. However, fellow statistician, and the Young Statisticians representative for the New Zealand Statistical Association executive committee, Kylie Maxwell has posted her own experience as part of the International Year of Statistics.


May 16, 2013

Back to my favourite topic – beer

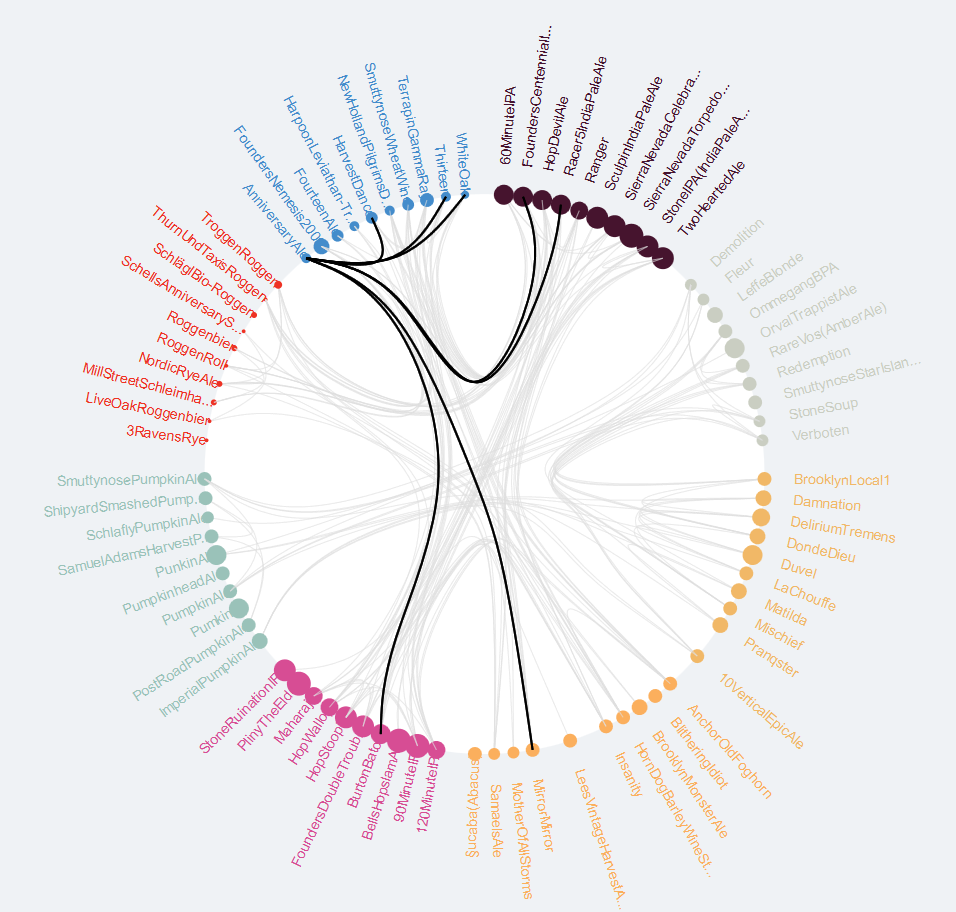
BeerVis Graph

Here is a site to show with a flourish when your friends tell you at the pub that studying Statistics is no use. LifeHacker reports that BeerViz attempts to use historical data collected by BeerAdvocate, and presumably a statistical model, to suggest new beers to you based on what you already like. If they’re not using a statistical model then there is a great challenge for you loyal readers!

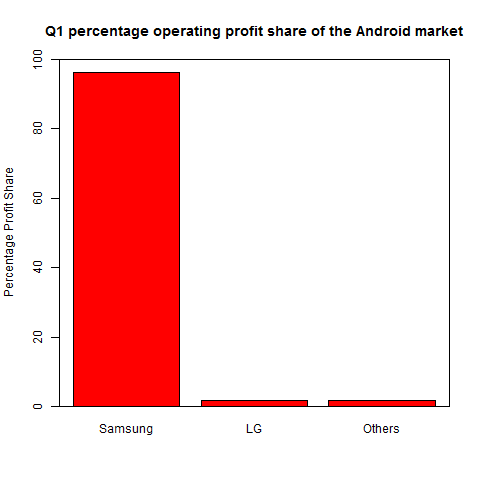
Whichever way you look it – “Is that an Android, I mean Samsung you’re holding there?”

A report by research firm Strategy Analytics has estimated that Korean electronics giant Samsung took a whopping 94.7% share of the $US5.3 billion first quarter operating profits for Android handset sales. Whichever way you look at it, currently Samsung is the Android platform of choice.
Samsung Market Share
The Register notes that the same report notes that Android has 43% of the smartphone market share.

May 10, 2013

The Art of Data Visualisation

The information content in this video (7m38s) from PBS’ Off Book series is on the low side but its still an interesting watch, if only for a large collection of graphic designers’ appealing but appalling infographics.

April 12, 2013

Random numbers from a radioactive source

Here’s a fun link which talks about the difference between truly random numbers and pseudo-random numbers. When we teach this, we often mention generation of random numbers (or at least the random number seed) from a radioactive source as one way of getting truly random numbers. Here is someone actually doing it. The sequel is well worth a watch too if you have the time.

September 27, 2012

How is the beer up (down) here?

UBS economists have produced a nice graph showing how many minutes does it take to earn a beer. There is one fatal flaw however – it doesn’t have New Zealand! I thought we had better remedy this (maybe I am just avoiding something). The graph takes the average price for 500mL of beer, and divides it by the median hourly wage. The dollar figures, I assume, are all converted to US dollars so that everything is on the same scale. Statistics New Zealand helpfully provides us with the average hourly wage for 2011 – NZD20.38, and pricepint.com uses the power of crowd-sourcing to give us the average price of a pint in New Zealand at GBP2.36. Converting both of these figures in to US dollars gives us USD16.8241 and USD3.82047 respectively at today’s rates from xe.net This means on average it takes 13.62 minutes to earn a pint in New Zealand. There are no figures on the plot, but we seem to sit somewhere between Australia and Argentina, our fellow Rugby Championship competitors, but a long way below South Africa.

March 30, 2012

Lotto silliness

As my good friend and colleague Thomas Lumley points out we have plenty of Lotto-based silliness to tide us over until the next stupid health related press release from a conference with no quality checks. Case-in-point is the article Powerball could be in the stars in Thursday’s NZ Herald (29 March, 2012, A5): (also nominated by Sammie Jia for Stat of the Week).

The article reports the frequency of zodiac signs from a survey of 104 first division Lotto winners, and gleefully touts Taurus as the luckiest star sign with 13% of the total. The article gives us a summary table:

Taurus 13%
Libra 11%
Capricorn 10%
Aquarius 9%
Virgo 9%
Pisces 9%
Leo 8%


Of course, all keen Statschat readers will note that this table does not add up to 100%, nor does it show all twelve zodiac signs, which is not very helpful. Buried in the text is the additional information that Aries and Cancer combined make up 4% of the total.

If we spread the remaining probability over Gemini, Sagittarius and Scorpio, and make the not entirely justified assumption that the distribution of zodiac signs is uniform (which is exactly what the NZ Herald has done), then we can perform a simple chi-squared test of uniformity. This yields a P-value of 0.22, which for most frequentists isn’t exactly compelling evidence.

Being a Bayesian, I prefer to assume multinomial sampling with the prior on the probability of success being uniform. The figure below shows posterior credible intervals (based on 10,000 samples) for the true probability of success. The red dots are the observed values. The dashed line is the equal probability line (0.083 = 1/12).


All of the intervals overlap confirming our statistical intuition that all we are really observing is sampling variation. Yes, Ares and Cancer do fall below the line, but they are not significantly different from the other signs. You can, of course, not believe me – in which case Thomas has some tickets from last week’s draw going very cheap and your chance of winning is almost the same.

February 23, 2012

Movie review: Moneyball

Moneyball is a semi-biographical film, starring Brad Pitt (Inglorious Basterds, Oceans 11-13, Fight Club), Jonah Hill (Superbad, Knocked Up) and Philip Seymour Hoffman (The Boat That Rocked, Charlie Wilson’s War, Capote), which tells the story of how the Oakland Athletics (better known as the Oakland A’s) reversed their 2001 baseball season performance with a minimal budget and the use of statistics. The film is a dramatisation of Michael Lewis’ 2003 book of the same name.

The film is an account of how Oakland’s general manager Billy Beane (Pitt) hired Yale economics graduate Peter Brand (Hill) as assistant GM to help assemble a new team with a relatively small budget. Small, at the time, was USD 40 million, which is about a third of the money being spent by the top teams in the league.

The story line, from a statistical point of view, is how the data can reveal a different picture from commonly perceived wisdom or prejudice. Beane’s management team is portrayed as a collection of old cronies and hangers-on, whose player selection method is based on “likes”,”dislikes” and rumours about form or injury, without apparent consideration of true performance. Brand, on the other hand, is portrayed as a true baseball geek, and a true geek – being pudgy, nerdy, far from athletic, and happier with a computer than people. It is an odd, stereotypical, choice given that tThe Brand character is fictional. In real life, Brand’s equivalent is Paul DePodesta, who is slim, Harvard (not Yale) educated, and a former baseball player. Brand/DePodesta is an ardent believer in methods developed by baseball historian, writer and statistician Bill James, who is credited as being the first person to use data and statistical methods to analyse player and team performance. James is credited with the term “sabermetrics” which derives from the Society for American Baseball Research (SABR).

As one would expect, the statistical aspects of the the storyline are reduced to playing the percentages. That is, Beane and Brand use the averages to gain competitive advantage over other teams. However, there is a hidden salutary message, in that statistics can only tell us what will happen on average, and says very little about individual events. I liked this because I felt it was a nice message about consideration of variation as well as the mean.

Overall, this was a generally enjoyable movie. It has been nominated for six Academy Awards including Best Picture. Some of the crunch points were lost on me and other members of the audience, because of our unfamiliarity with the rules and structure of a baseball game and the league as a whole. Don’t let this put you off, however. It is a fun David and Goliath-type story and will appeal to all.

Update: The use of fictional character Peter Brand was at Paul DePodesta’s request

December 21, 2011

Airbourne cocaine levels cause cancer

That got your attention didn’t it? The article Are You Inhaling Secondhand Coke? certainly got my attention when I read it on Slashdot but more in the kind of “correlation being misinterpreted as causation” way.

To be fair to the scientists in the study, they do actually say this, but the journalist who wrote it up did not find it necessary to include that information until the reader is about three quarters of the way through the article.

Somebody should nominate this for Stat of the Week.