Posts written by James Curran (32)

avatar

James Curran's interests are in statistical problems in forensic science. He consults with forensic agencies in New Zealand, Australia, the United Kingdom, and the United States. He produces and maintains expert systems software for the interpretation of evidence. He has experience as an expert witness in DNA and glass evidence, appearing in courts in the United States and Australia. He has very strong interests in statistical computing, and in automation projects.

November 9, 2011

What the frack?

The New Zealand Herald (09-Nov-2011) has a very interesting article about earthquakes in Oklahoma. Scientists from the Oklahoma Geological Survey plan to investigate whether the process of “fracking” has led to an increase in earthquake activity.

Fracking is a controversial fossil fuel recovery method whereby high pressure water is injected into rock, fracturing it, and then send is forced into the cracks allowing the substance of interest, in this case gas, to escape. This process has been known about for quite sometime, but it is the depletion of existing reserves, and the subsequent increase in the price of oil and gas that has made it exceptionally popular in recent times.

In Oklahoma, the principal fracking area is known as the Devonian Woodford Shale. According to Wikipedia, the first gas production was recorded in 1939, and by late 2004, there were only 24 Woodford Shale gas wells. However, by early 2008, there were more than 750 Woodford gas wells. Another site reports that currently over 1,500 wells have already been drilled with many more to come. The wells cost $US2-3 million, and there are more than 35,000 shale gas wells currently in the United States.

One of the nice things about the US Geological Survey, and its state based constituents, is that it is usually relatively easy to get data from them. I say relatively, because it required some searching and programming to speed the process up, but the data is all there for someone willing to spend sometime getting it.

To show fracking is causing an increase in seismic activity would require proper experimentation. However, it may be possible to show correlation at least between the increase in fracking wells and the number of seismic events. I don’t have enough clout, or time, to extract the information about the number of wells, and their location. However it is still interesting just to take a look at the data we can get regarding the number of earthquakes ourselves.

Time series plot of earthquakes in Oklahoma

The black line in time series plot above shows the number of seismic events from January 1977 to October 2011. The rise at the start of 2010 is certainty indisputable. The blue line a form of exponential smoothing called Holt-Winters smoothing (or Holt-Winters triple exponential smoothing). It is a simple statistical technique that attempts to model the trends (among other things) in time series data. The green line is the predicted number of earthquakes using this smoothing model (calculated on the pre-2010 data) for the time period starting January 2010 to October 2011, and the red line is the upper confidence limit on this prediction. This is a very simple modelling attempt, and undoubtedly the “real time-series analysts” could do better (and here is the data for you), but what I would like to think this shows is that the increase in quake count is so far off the charts that it definitely qualifies for further investigation.

Some of you will no doubt be grumbling that I have not accounted for the magnitude, or depth, or location, or in fact many other things, and indeed I have not. However, I do think the data is interesting, and the association with the increase in fracking should be explored further – which is what the Oklahoma Geological Survey plans to do.

I have made the uncleaned raw data available here.

October 20, 2011

The use of Bayes’ Theorem in jeopardy in the United Kingdom?

A number of my colleagues have sent me this link from British newspaper The Guardian, and asked me to comment. In some sense I have done this. I am a signatory to an editorial published in the journal Science and Justice which protests the law lords’ ruling.

The Guardian article refers to a Court of Appeal ruling in the United Kingdom referred to as R v T. The original charge against Mr. T. is that of murder and, given the successful appeal, his name is suppressed. The nature of the appeal relates to whether an expert is permitted to use likelihood ratios in provision of evaluative opinion, whether an evaluative opinion based on an expert’s experience is permissible, and whether it is necessary for an expert to set out in a report the factors on which evaluative opinion based.

It is worthwhile noting before we proceed that to judge a case solely on one aspect of the whole trial is dangerous. Most trials are complex affairs with many pieces of evidence, and much more testimony that the small aspects we concentrate on here.

The issue of concern to members of the forensic community is the following part of the ruling:

In the light of the strong criticism by this court in the 1990s of using Bayes theorem before the jury in cases where there was no reliable statistical evidence, the practice of using a Bayesian approach and likelihood ratios to formulate opinions placed before a jury without that process being disclosed and debated in court is contrary to principles of open justice.

The practice of using likelihood ratios was justified as producing “balance, logic, robustness and transparency”, as we have set out at [54]. In our view, their use in this case was plainly not transparent. Although it was Mr Ryder’s evidence (which we accept), that he arrived at his opinion through experience, it would be difficult to see how an opinion of footwear marks arrived at through the application of a formula could be described as “logical”, or “balanced” or “robust”, when the data are as uncertain as we have set out and could produce such different results.

A Bayesian, or likelihood ratio (LR) approach to evidence interpretation, is a mathematical embodiment of three principles of evidence interpretation given by Ian Evett and Bruce Weir in their book Interpreting DNA Evidence: Statistical Genetics for Forensic Scientist. Sinauer, Sunderland, MA 1998. These principles are

  1. To evaluate the uncertainty of any given proposition it is necessary to consider at least one alternative proposition
  2. Scientific interpretation is based on questions of the kind “What is the probability of the evidence given the proposition?”
  3. Scientific interpretation is conditioned not only by the competing propositions, but also by the framework of circumstances within which they are to be evaluated

The likelihood ratio is the central part of the odds form of Bayes’ Theorem. That is
Bayes' Theorem

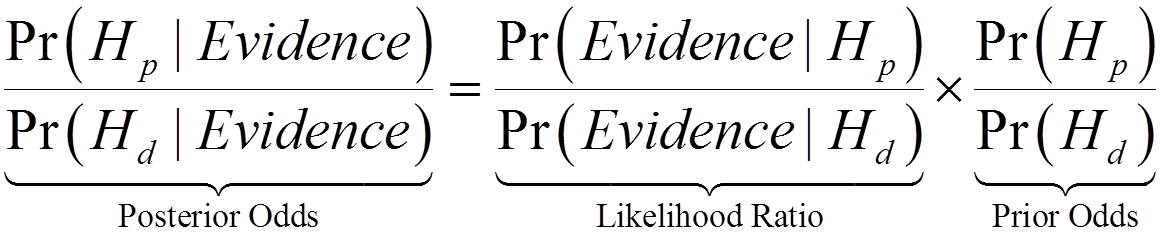
The likelihood ratio gives the ratio of the probability of the evidence given the prosecution hypothesis to the probability of the evidence given the defense hypothesis. It is favoured by members of my community because it allows the expert to comment solely on the evidence, which is all the court has asked her or him to do.

The basis for the appeal in R v T was that the forensic scientist, Mr Ryder, in the first instance computed a likelihood ratio, but did not explicitly tell the court he had done so. In the second instance, there was also criticism that the data needed to evaluate the LR was not available.

Mr Ryder considered four factors in his evaluation of the evidence. These were the pattern, the size, the wear and the damage.

The sole pattern is usually the most obvious feature of a shoe mark or impression. Patterns are generally distinct between manufacturers and to a lesser extent between different shoes that a manufacturer makes. Mr Ryder considered the probability of the evidence (the fact that the shoe impression “matches” the impression left by the defendant’s shoe) if it indeed was his shoe that left it. It is reasonable to assume that this probability is one or close to one. If the defendant’s shoe did not leave the mark, then we need a way of evaluating the probability of a “adventitious” match. That is, what’s the chance that the defendant’s shoe just happened to match by sheer bad luck alone? A reasonable estimate of this probability is the frequency of the pattern in the relevant population. Mr Ryder used a database of shoe pattern impressions found at crime scenes. Given that this mark was found at a crime scene this seems a reasonable population to consider. In this database the pattern was very common with a frequency of 0.2. The defense made much stock of the fact that the database represented only a tiny fraction of the shoes produced in the UK in a year (0.00006 per cent), and therefore it was not comprehensive enough to make the evaluation. In fact, the defense had done its own calculation which was much more damning for their client. Using the 0.2 frequency gives a LR of 5. That is, the evidence is 5 times more likely if Mr T.’s shoe left the mark rather than a shoe of a random member of the population.

The shoe size is also a commonly used feature in footwear examination. The shoe impression was judged to be size 11. Again the probability of the evidence if Mr T.’s shoe left the mark was judged to be one. It is hard to work out exactly what Mr Ryder did from the ruling, because a ruling is the judges’ recollection of proceedings, which is not actually an accurate record of what may, or may not, have been said. According to the ruling, Mr Ryder used a different database to assess the frequency of size. He estimated this to be 3%. The judges incorrectly equate this to 0.333, instead of 0.03 which would lead to an LR of 33.3. Mr Ryder used a “more conservative” figure to reflect to some uncertainty in size determination to 0.1, giving an LR of 10.

Wear on shoes can be different between different people. Take a look at the soles of your shoes and those of a friend. They will probably be different. To evaluate the LR, Mr Ryder considered that the wear on the trainers. He felt could exclude half of the trainers of this pattern type and approximate size/configuration. He therefore calculated the likelihood ratio for wear as 1/0.5 or 2. Note here that Mr Ryder appears to have calculated the probability of wear given pattern and size.

Finally, Mr Ryder considered the damage to the shoes. Little nicks and cuts accumulate on shoes over time and can be quite distinctive. Mr Ryder felt he could exclude very few pairs of shoes that could not previously have been excluded by the other factors. That is the defendant’s shoes were no more, or less, likely to have left the mark than any other pair in the database that had the same pattern, size and wear features. Therefore therefore calculated the likelihood ratio for damage as 1.

The overall LR was calculated by multiplying the four LRs together. This is acceptable if either the features were independent, or the appropriate conditional probabilities were considered. This multiplication gave an LR of 100, and that figure was converted using a “verbal scale” into the statement “the evidence provides moderate support for the proposition that the defendant’s shoe left the mark.” Verbal scales are used by many forensic agencies who employ an LR approach because they are “more easily understood” by the jury and the court.

The appeal judges ruled that this statement, without the explicit inclusion of information explaining that it was based on an LR, was misleading. Furthermore, they ruled that the data used to calculate the LR was insufficient. I, and many of my colleagues, disagree with this conclusion.

So what are the consequences of this ruling? It remains to be seen. In the first instance I think it will be an opening shot for many defense cases in the same way that they try to take down the LR because it is “based on biased Bayesian reasoning.” I do think that it will force forensic agencies to be more open about their calculations, but I might add that Mr Ryder didn’t seek to conceal anything from the court. He was simply following the guidelines set out by the Association of Footwear, Tool marks, and Firearms Examiners guidelines.

It would be very foolish of the courts to dismiss the Bayesian approach. After all, Bayes’ Theorem simply says (in mathematical notation) that you should update your belief about the hypotheses based on the evidence. No judge would argue that against that.

October 18, 2011

Blackberry outage lowers accident rate in the UAE?

Quite a few websites are linking to an article in Abu Dhabi newspaper The National that reports claims a recent worldwide Blackberry service outage led to a 40% fall in the traffic accidents in Abu Dhabi and 20% in Dubai – although the police haven’t released the specific numbers. The suggestion is that people couldn’t use their devices while driving so weren’t suffering from accidents caused by distraction.

According to an earlier article in The National, there were approximately 320 traffic accidents a day in Abu Dhabi (116,487 in total) in 2009, or approximately one accident every 4.5 minutes. The current article claims that there is now an accident every 3 minutes in Abu Dhabi (320 a day, 175,200 a year).

Now these sort of numbers look impressive, but, as we have seen previously in a Thomas Lumley post about New Zealand’s accident figures, they can be a bit misleading.

The population of Abu Dhabi in 2009 was estimated to be 896,751. The estimated population of the emirate was put at around 1.643 million. Using the smaller figures, the accident rate is about 1 every 7 years, which as Thomas previously pointed out, sounds somewhat less impressive than one every 3 minutes.

To put the 2011 figures in perspective, we need an estimate of the current population size, which we don’t have – a census is due to be carried out this year. The population of Abu Dhabi is increasingly rapidly (in 1975 there were ~200,000 in the emirate). If we choose a conservative figure of 1 million, the accident rate has gone up a bit to one about every 5.7 years. If the 40% is real, and was applied to every day of the year, this figure would change to 1 accident in every 9.5 years.

Of course, not everyone in the population is a driver! 57% of the population is aged 15-64 (which totals 511,148 people), and in 2008 there were 676,660 drivers. The demographics of the United Arab Emirates (UAE), of which Abu Dhabi and Dubai are a part, are quite interesting. The male/female sex ratio (in the 15-65 age group) is highly skewed at 2.743, or approximately 73.3% male and 26.7% female, and according to this article only 15% of drivers (in Dubai) with licenses are females. So let’s look at this again. In 2008 there were 116,487 accidents amongst approximately 676,660 drivers which works out to be 0.17 accidents per driver for the year, or 1 every 5.8 years. The rates are undoubtedly different for males and females.

What can we say from all this? Not a lot, but even if the dip in traffic accidents is real, it is unlikely to have a major effect on the annual total.

October 6, 2011

Infinite monkeys, Shakespeare, and all that…

There was a large amount of fuss made about a week ago (26/09/2011) at various news and hi-tech blog sites about story claiming that “this is the first time a work of Shakespeare has actually been randomly reproduced.” On the surface of it, this seemed utterly implausible.

For those of you not familiar with the “Infinite Monkeys theorem”, it essentially states that “an infinite number of monkeys randomly bashing away on typewriters/keyboards for an infinite amount of time will almost surely recreate the entire works of Shakespeare.” You can read more about it here on Wikipedia.

I took a look at the author’s own site and found the description of his experiment quite confusing with poorly defined objectives. It seemed to me that he was just randomly generating character sequences and if he found a matching word within the relevant Shakespeare text, then he counted it as completed. This is not what I understood as the Infinite Monkeys theorem because there is no requirement that the words be generated in the correct order. What was even more puzzling was his choice of 9-characters at a time.

I asked my esteemed colleague Professor Thomas Lumley for his thoughts on the matter. He had this to say:

“In order to get this to work in reasonable time, it sounds as though he is working with nine-character random strings and keeping each string if it matches some nine-character substring of Shakespeare. This means that he is guaranteed to finish in about 27^9 samples (if he uses just letters and spaces).

If he used one-character sequences it would be over a lot faster, and with 20-character sequences it would take a very, very long time.

I assume the 9-character limit was so that the Bloom filter fits in memory easily.”

Thomas also discovered another blogger making almost identical points.

It seems that the Bard is safe from monkeys for some time to come.

August 30, 2011

Want to try out your statistics skills for real?

www.kaggle.com hosts many data mining and statistical prediction competitions, some with big prizes (USD10,000+). Have you got what it takes to win?

August 25, 2011

Are Māori and Pacific people really over-represented in taser stats?

Today’s NZ Herald reports that Māori and Pacific Islanders are highly represented in the statistics for the use of tasers by the NZ police. Green MP Keith Locke is quoted as saying “Certainly they’re being fired disproportionately at Māori.” Mana Party spokeswoman Annette Sykes is quoted as saying “there has been this disproportionate outcome for Māori and Polynesian individuals, which is a sad indictment on us.”

Looking at the numbers, a taser has been used 35 times out of a total of 88 on Māori, or just under 40%. This is certainly much higher than 15% reported for the percentage of Māori from the 2006 census. However, this is not the relevant population. Rather, we should consider the proportion of Māori involved in the criminal justice system.

Figure 1, on page 17 of the report on Identifying and Responding to Bias in the Criminal Justice System: A Review of International and New Zealand Research (Bronwyn Morrison, Ministry of Justice 2009: p17) shows that approximately 40% of individuals involved New Zealand criminal justice system (in 2006) were Māori. These figures support the statement by Police Minister, Judith Collins that “the figures merely reflect the “sad fact” that Māori are over-represented in crime statistics.”

For those of you who like the statistics, then assuming a binomial model, the probability of observing 35 or more out of 88 incidents with p = 0.4, is approximately 0.47.

What do we take from this? Māori are not over-represented in the taser statistics. They occur in almost exactly the same proportion as they do in all other aspects of the criminal justice system.

92 minutes of exercise a week to increase your life expectancy by 3 years

July 29, 2011

Media’s role in dominance of emotions over statistics about travel risks

Journalists urged to ask if “the numbers make sense”

June 19, 2011

The misuse of DNA statistics

From the NZ Herald:

CIA personnel there compared it “with a comprehensive DNA profile derived from DNA collected from multiple members of bin Laden’s family,” the statement said. “The possibility of a mistaken identification is approximately one in 11.8 quadrillion.”

This is a common misreporting of DNA statistics and it highlights the confusion regarding evidence interpretation. The figure, 1 in 11.8 quadrillion, quoted in the CIA statement is known as a random match probability. It answers a specific question. In this case the question is, “What is the probability someone else has this profile, given what we know about the alleged victim’s (bin Laden) DNA profile, and the profiles of his extended family?” Note that this is a very different question from what is the probability that this DNA comes from someone other than Mr bin Laden?”

This is a very common mistake, so common in fact that it has a name, the Prosecutor’s fallacy. The fallacy usually relates to a misunderstanding regarding conditional probability.

In this case it is far more likely that the DNA analyst calculated a likelihood ratio. The likelihood ratio compares the probability of the evidence under two competing hypotheses. In this case sensible hypotheses might be, Hp: the body is Mr bin Laden and Hd: the body is someone unrelated to Mr bin Laden. The correct statement would be “The (DNA) evidence is 11.8 quadrillion times more likely if the body is Mr Bin Laden rather than if the body belongs to someone other who is unrelated to Mr bin Laden.” This is a statement about the evidence not about the hypotheses.

It is possible to give a statement regarding the hypotheses, but in order to do this we have to have some prior probabilities associated with them before we consider the evidence. The statistical formula that allows us to reverse the probability statements is known as Bayes’ Theorem.

Do I think the body belongs to someone other than Mr bin Laden? No, but I do think there is an obligation to use statistics correctly.