April 24, 2013
Note with worrying statistics at Pakiri horse riding
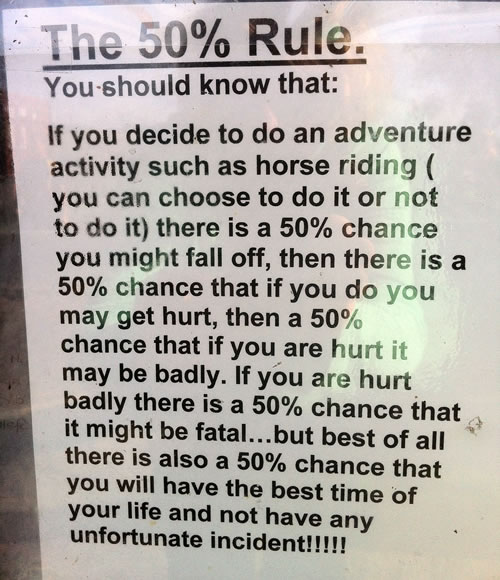
Karen McDonald is the department manager.
Great interview on Radio NZ this morning, with Eli Pariser author of ‘The Filter Bubble: What the Internet is Hiding from You’.
Content as well as advertising is now targeted to users. So internet users receive information that reflect their own opinions and interests and as Pariser comments “we don’t see how our experience of the web is different from anyone else’s”. By making our searches personally relevant and individually likeable (“if you like this fact you’ll like that fact”) we don’t get exposed to different perspectives. And we have not had the opportunity to ‘opt out’ of this search personalisation.
Online personalisation started for Google Dec 4 2009. Evidently 57 data points are used including such variables as your past searches, technology and font you use, where you are located, your speed of clicking through. Pariser says, “the watch word in Silicon Valley these days is relevant”.
Mark Zuckerburg of Facebook has been quoted “a squirrel dying in your front yard may be more relevant to you right now than people dying in Africa.” Pariser comments, “I worry about what a web and what a news ecosystem that is built on that idea of relevance might look like”. Presentation by Pariser on this is also here.
The discussion on the benefit of the editorial role in main stream media with the premise of the civic responsibility and ethics, compared to the algorithmic feed of personalised news on the web is interesting food for thought given the current News of the World story.
I enjoyed this Hans Rosling clip from YouTube:
Hans Rosling’s famous lectures combine enormous quantities of public data with a sport’s commentator’s style to reveal the story of the world’s past, present and future development. Now he explores stats in a way he has never done before – using augmented reality animation. In this spectacular section of ‘The Joy of Stats’ he tells the story of the world in 200 countries over 200 years using 120,000 numbers – in just four minutes. Plotting life expectancy against income for every country since 1810, Hans shows how the world we live in is radically different from the world most of us imagine.
More about this programme: http://www.bbc.co.uk/programmes/b00wgq0l
Recent comments on Karen McDonald’s posts