Posts written by Thomas Lumley (2645)

avatar

Thomas Lumley (@tslumley) is Professor of Biostatistics at the University of Auckland. His research interests include semiparametric models, survey sampling, statistical computing, foundations of statistics, and whatever methodological problems his medical collaborators come up with. He also blogs at Biased and Inefficient

August 23, 2012

Where does 80m of molten rock end up?

Wherever it wants.

Apparently, if the next Auckland volcano is in the worst possible location, 500000 people might need to be evacuated.  Even in a better location it will be no fun at all, with the only redeeming feature being that even Peter Thompson will have to concede that it’s not the best time to buy a house.   It’s good that research and planning is underway, so the mayor’s office will have a set of contingency plans filed under “V” for when the next eruption happens, but the need for public panic awareness is perhaps less than for the Alpine Fault.

From a statistical viewpoint, there are two factors that go into how much you should do to prepare for an emergency: how likely it is, and how much the preparation will help.   The earthquake wins on both of these: it’s about ten times as likely in the next 50 years, and we can do a lot more to reduce the damage.  With the Alpine Fault, we need to decide how much to spend on strengthening roads, bridges, and houses, and making water and sewer systems less likely to break.  Public discussion and pressure on the government are important.  On the other hand, if a river of molten rock heads south from One Tree Hill, or a chunk of tuff the size of a refrigerator lands on my roof, my house isn’t going to survive no matter how good the building standards are.

In terms of things we can actually influence, we might want to worry more about which bits of Auckland will be under water in 50-100 years, not which bits will be under lava.
August 22, 2012

Non-awful lottery story

Stuff has a story on today’s Big Wednesday lotto that doesn’t say anything obviously untrue or misleading.  I’m sure this isn’t a first, but it is rare enough to be notable.

The story doesn’t say anything about the odds, but in a sense that’s not the point: you don’t play the lottery to win, you play it to imagine winning.  To quote another statistician

The benefit to playing the lottery comes entirely between buying the ticket, and when the winner is revealed. During this interval, someone who has bought the ticket can entertain the idea that they might win, and pleasantly imagine how much better their life could be with the money, what they would do with it, etc. … If a $1 lottery ticket licenses even one hour of imagining a different life, I don’t see how people who spend $12 for two or three hours of such imagining at a movie theater, or $25 for ten hours at a bookstore, are in any position to talk.


August 21, 2012

Show us the sources

The Herald has a good story today about attitudes to depression (unfortunately, only in Australia, but you can’t have everything).

Judging from the information on the beyondblue website about the 2001-2 survey, this is a real survey using random telephone sampling.  It’s asking important questions, and the Herald’s story summarises the worrying level of ignorance about depression among Aussies.  Notably, “62 per cent wrongly believe antidepressant medication is addictive” — the problem is the reverse, these medications are often difficult to keep taking for the necessary extended periods of time.

I said that I was judging from the information about the 2001-2 survey.  The webpage was last updated in 2006, and it says they are looking to do a second survey in 2004. Some more Googling suggests that they did a second survey in 2007-8, but I can’t find any results.  The media releases page doesn’t say anything, and the most recent release listed is from a month ago.

In the modern world it’s a pity that organisations can’t be more consistent about posting for the rest of us the information that they send out to the media. Then we might even have more success in persuading the media to link to it.

Measuring what you care about

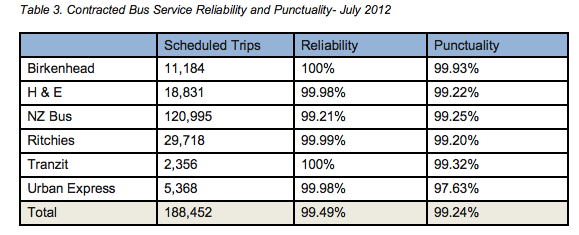
The Herald is reporting on Auckland Transport’s monthly report (you can find the reports here).  One of the recurring surprises in these reports is how high the punctuality figures are, and the Herald comments on these for some of the train services.

The bus punctuality statistics are even shinier


As a regular bus commuter it’s hard to imagine how these could be correct — and if they were, there would be no need for the real-time bus predictions, since the timetables would be more accurate than the predictions.

The solution is in the fine print: “Service punctuality for July 2012 was 99.24%, measured by the percentage of services which commence the journey within 5 minutes of the timetabled start time and reach their destination“.

Or, to quote Lewis Carroll’s Humpty Dumpty “When I use a word it means just what I choose it to mean — neither more nor less”

Queueing theory and practice

There’s an interesting story in the New York Times about queueing, a subject dear to the hearts of some of my colleagues.  In one sense queueing is a topic in probability theory, where you work out how long people might have to wait under various circumstances, leading to surprising but useful techniques such as metered on-ramps to motorways.  But it’s also a topic in applied psychology: if you get off your plane ten minutes before your bags arrive at the carousel, you’ll notice the wait less if you spend most of it walking. So that’s what the airports make you do.

August 20, 2012

Nostra maxima culpa

As Alan Keegan points out in his Stat of the Week nomination, the Stats Department Facebook page was sporting a graph whose only redeeming feature is that it doesn’t even pretend to convey information.

To decide what to do with the graph, we are hosting a bogus poll:


August 19, 2012

Buses are good for you?

From Stuff, under the headline “Public transport ‘good for your health'”

Waiting for public transport may seem dull, but new research shows daydreaming at the bus stop may be good for your mental health.

Wouldn’t it be nice to think so? Unfortunately, what the research actually found is a bit different:

In a survey of 1025 public transport passengers in Wellington and Auckland, 47 per cent said the way they had spent their time had a positive effect on their health and wellbeing, and 48 per cent said there was no effect either way.

That is, people who take the bus say they think taking the bus is ok (well, we would, wouldn’t we): there’s no actual health data or comparisons.   You might want to compare this with a large Swedish study that came out last year, which found poorer physical and mental health in people with long commutes, with no real difference between transit and car.

Also, the ‘good for your health’ in the headline is claiming to be a quote, but the quote doesn’t appear in the story.

Big Data is watching you

Or, as some of my colleagues would prefer “Big Data are watching you”.  In Stuff.   The story is about the potential disadvantages of your life being predictable by sophisticated analysis, and it’s pretty good.

I will comment on one example:

The Corrections Department first developed a computer system, RocRol, in 1995 that calculates the chances of prisoners being reconvicted within five years of their release…

Corrections analyst Arul Nadesu told a conference at Te Papa in February that new software developed by business analytics firm SAS that incorporates neural networking technology – a technique for processing data that mimics the way signals are passed between neurons in the brain – could reduce the risk of RocRol “misclassifying” an offender to just one in seven.

The software may be new, but neural networks for prediction have been around since the 1960s, when people did really believe that they mimicked the way the brain works. Neuroscience has come a long way since then.  Neural networks were very popular in the 1980s, but by the time I learned about them in the early 1990s they were no longer anything special or distinctive.

Also reduce the risk … to just one in seven” suggests that it’s substantially worse than one in seven at the moment. While things may change in the future, that’s exactly the current problem with Big Data: the predictions aren’t all that good


August 17, 2012

More for support than illumination

StatsChat has been mentioned again by National Business Review, though they attribute StatsChat to Stats New Zealand.  They are using my post on cybercrime to attack the proposed internet anti-bullying laws.   Personally, I’m not convinced my post supports their argument, but you can judge that for yourselves.

One thing I will point out: that $625 million cybercrime number that I criticized and that they are now disparaging? They used it in a headline as recently as June.


August 16, 2012

Probabilistic weather forecasts

For the Olympics, the British Meterology Office was producing animated probabilistic forecast maps, showing the estimated probability of various amounts of rain or strengths of wind at a fine grid of locations over Britain.  These are a great improvement over the usual much more vague and holistic predictions, and they were made possible by a new and experimental high-resolution ensemble forecasting system.  (via)

I will quibble slightly about the probabilities in the forecast, though.  The Met Office generates a set of predictions spanning a reasonable range of weather models and input uncertainties, and then says “80% change of rain” if 80% of the predictions have rain at that location.   That is, 80% means an 80% chance that a randomly chosen prediction will say “rain”, it doesn’t necessarily mean that “out of locations and hours with 80% forecast probability, 80% of them will actually get rain”.

It’s possible to improve the calibration of the probabilities by feeding the ensemble of predictions into a statistical model, and researchers at the University of  Washington have been working on this.  Their ProbCast page gives probabilistic rain and temperature forecasts for the state of Washington that are based on a statistical model for the relationship between actual weather and the ensemble of forecasts, and this does give more accurate uncertainty numbers.