Average housecat shown for scale
Via Edward Tufte on Twitter, from an Indiana newspaper
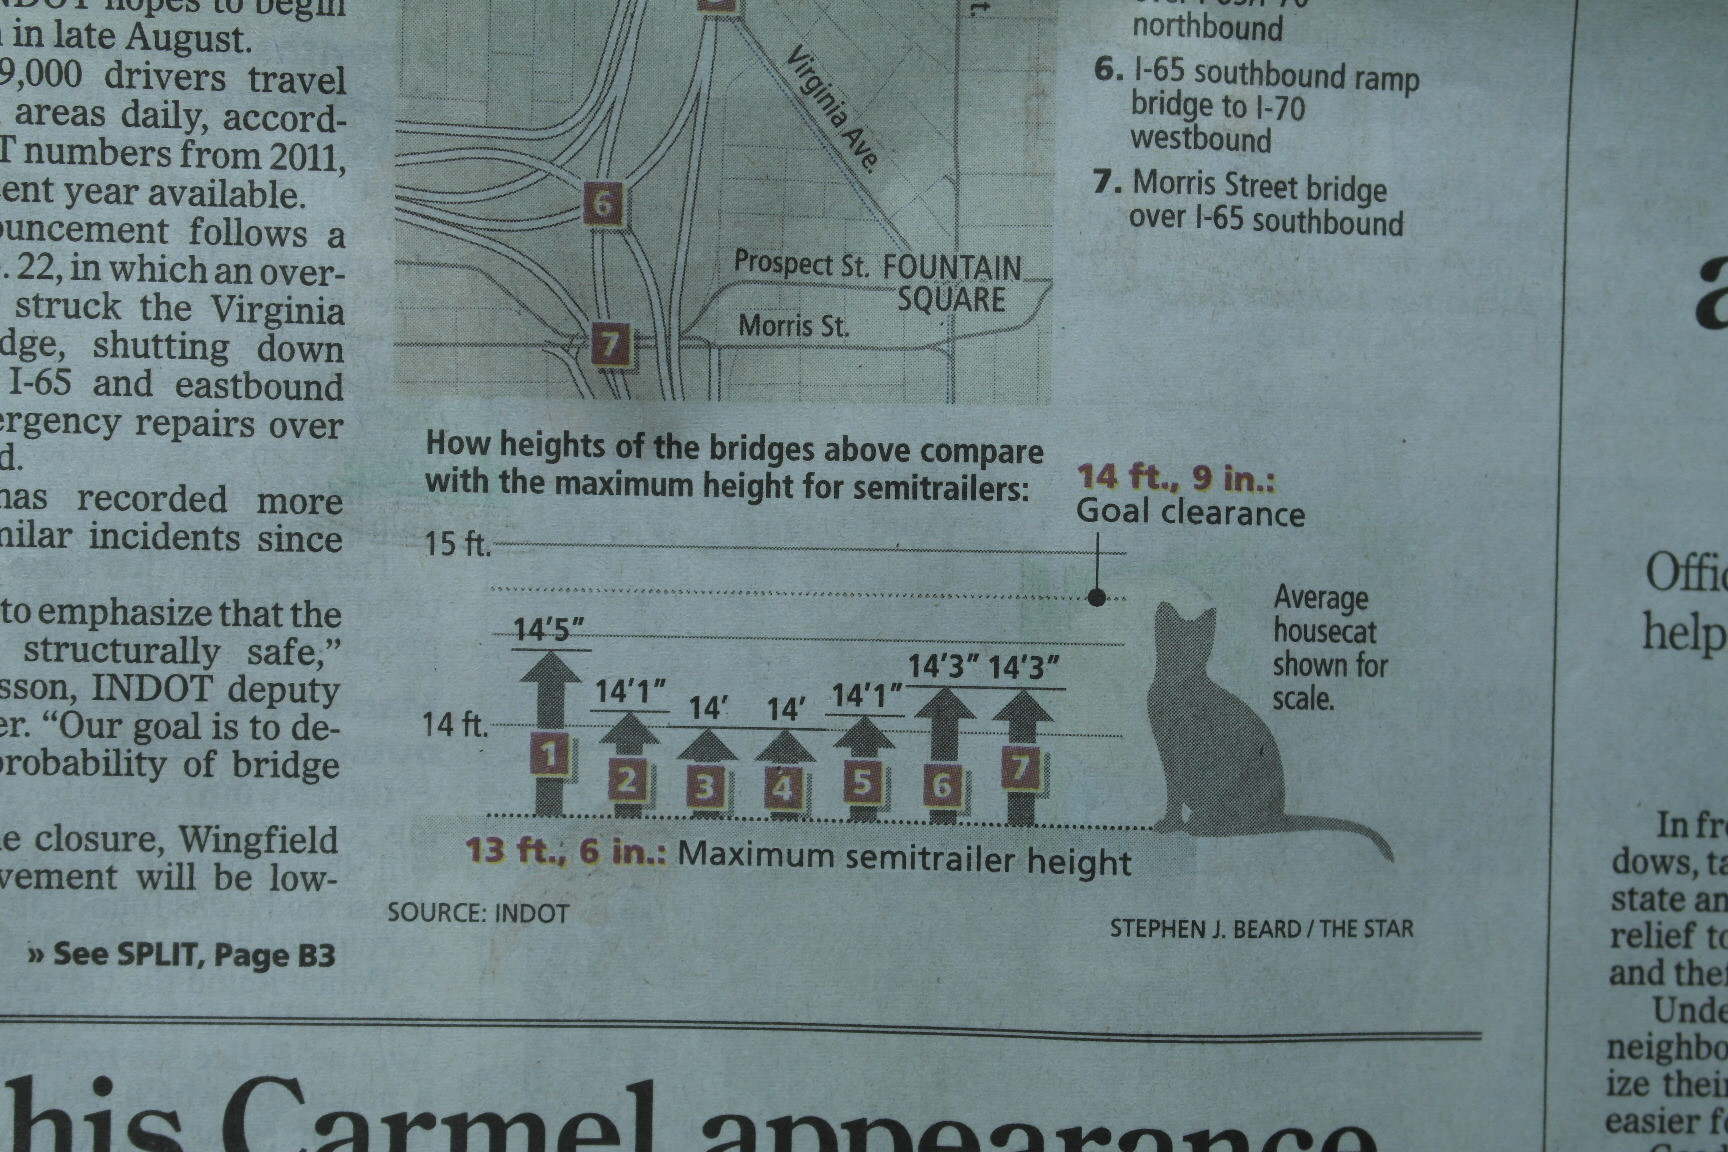
This is an unusual example of a design that is imaginative, correct, and informative, but is ruined by being much, much easier to misread than to read correctly. The y-axis scales starts at 13ft 6in, the maximum height of a semitrailer, and the graph shows a set of bridges that provide less than 1ft clearance above this, with a cat for scale.
The intended message is that there’s not enough clearance on these bridges: less space than a cat would take up. Unfortunately, the obvious reading (to me and to the internets) is “Attack of the 14ft Cat”
Thomas Lumley (@tslumley) is Professor of Biostatistics at the University of Auckland. His research interests include semiparametric models, survey sampling, statistical computing, foundations of statistics, and whatever methodological problems his medical collaborators come up with. He also blogs at Biased and Inefficient See all posts by Thomas Lumley »