Posts filed under Graphics (394)

February 1, 2019

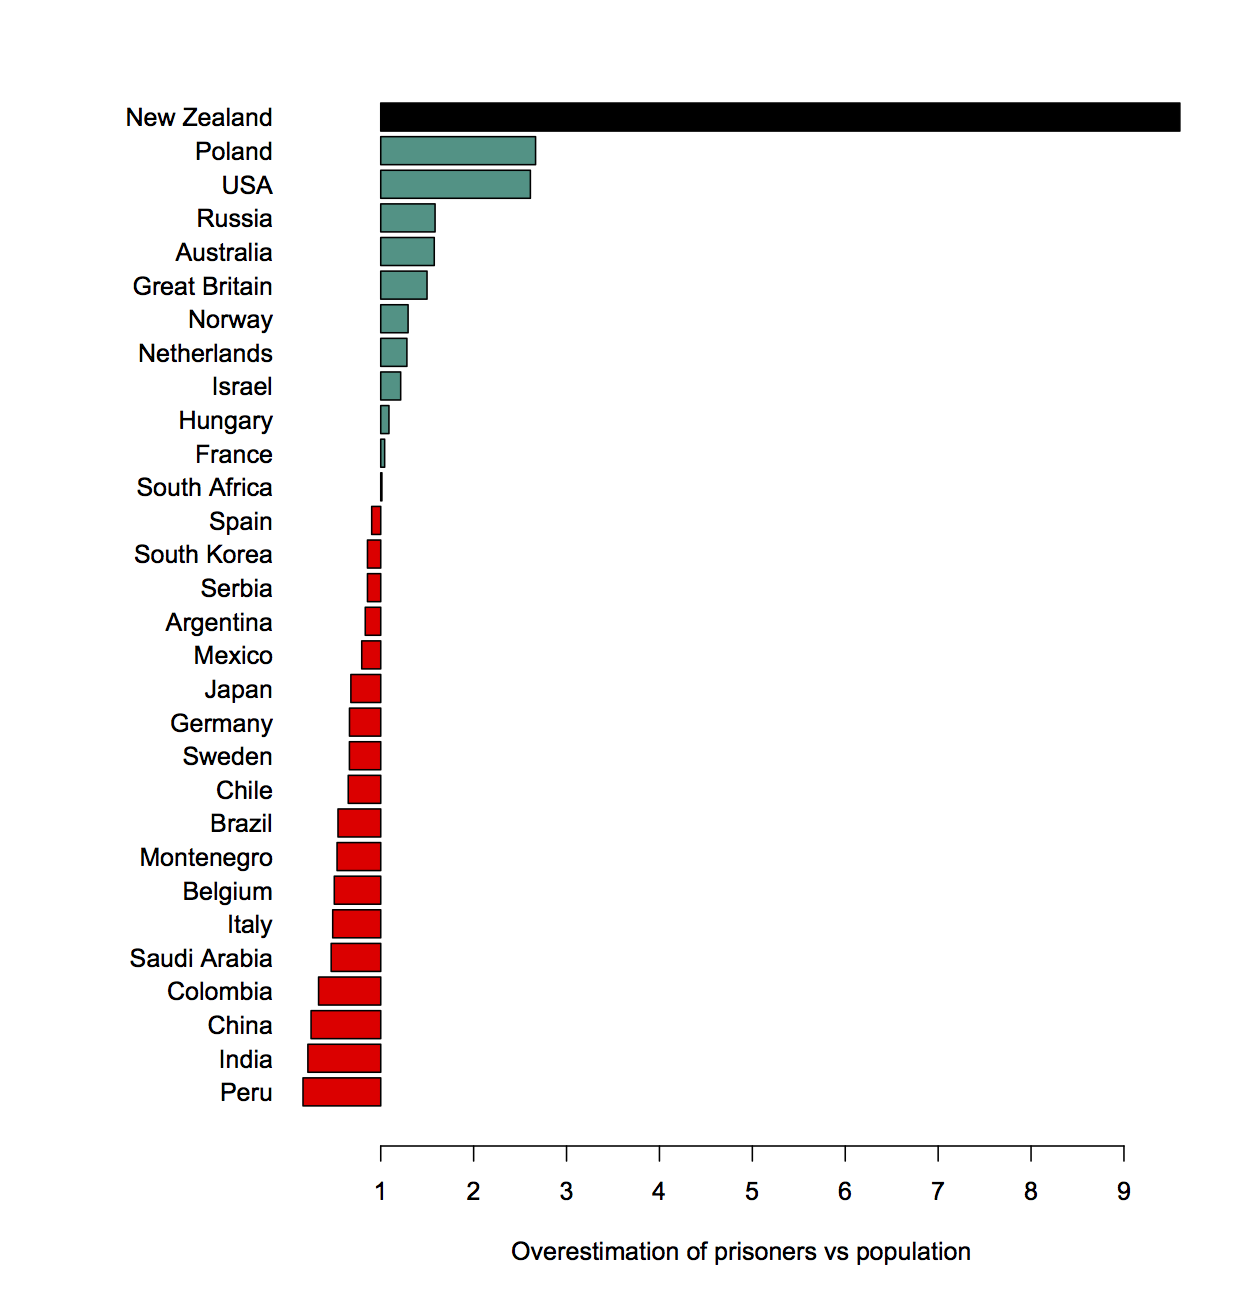
Meet Yiwen He, Statistics Summer Scholar

Every summer, the Department of Statistics offers scholarships to high-achieving students so they can work with staff on real-world projects. Yiwen, below, is working with Professor Chris Wild on iNZight, the free data visualisation and analysis software he developed.

Yiwen is doing a conjoint BSc and BCom majoring in Statistics, Mathematics and Finance at the University of Auckland. She’s from China, and moved here seven years ago.

Yiwen is working on the Department of Statistics-based data analysis package iNZight.

This is a free, R-based environment started by statistics education expert Professor Chris Wild to help high-school students quickly and easily explore data and understand some statistical ideas.

However, iNZight has grown, and now extends to multivariable graphics, time series, and generalised linear modelling, including modelling of data from complex surveys. It is available in web and desktop versions.

As iNZight has expanded, it has needed tweaking and tidying, and Yiwen is working on how it copes with incoming data that has date and time fields telling us when something happened. “These data are most likely to be in non-standard form, meaning our computing software cannot recognise and get useful information from it,” she explains.

Yiwen has been working with the iNZight team to develop functions to convert raw dates and times data to a standard format that iNZight can recognise, and extract desired components from a dates-and-times variable. “If we are able to automate how dates and times are handled by our computing software, we can plot dates and times together with our observations.”

Yiwen is finding the work stimulating and fun, “since we get to do things that are more practical, and it is exciting to see how the functions you build actually work on various data sets. And since we are given plenty of time in the project, it really encourages you to explore what is out there and extend your knowledge to more advanced coding stuff.”

High-achieving students like are a critical part of the development of iNZight, says Chris Wild. “It’s a student-driven project, so most of the big-scale changes occur over the New Zealand summer period. At other times, we mostly work on small changes and bug fixes.”

+ For general information  on University of Auckland summer scholarships, click here.


January 31, 2019

It’s warm out there

We’re seeing a lot of international news stories about cold weather in the US, and here in NZ we’re also seeing a lot of stories about hot weather locally and in Australia. You might think from the news coverage that the northern hemisphere is currently colder than usual and the southern hemisphere is currently warmer than usual.

This map (from) shows ‘temperature anomaly’, that is, the difference between the temperature today and the 1979-2000 average for the time of year.

There are some cold spots on the map: the north-east of North America and parts of northern Russia are much colder than usual. There are also hot spots, in Alaska and in the Arctic Sea.   And as the summaries under the map show, the northern hemisphere is more unusually hot (on average) than the southern hemisphere.

Weather is what matters to us day to day: especially the weather around us and the weather in places with English-speaking television stations.  That can give a very misleading view of the state and trend of global climate.


October 2, 2018

Pharmac rebates

There’s an ‘interactive’ at Stuff about the drug rebates that Pharmac negotiates. The most obvious issue with it is the graphics, for example

and

The first of these is a really dramatic illustration of a well-known way graphs can mislead: using just one dimension of a two-dimensional or three-dimensional thing to represent a number. The 2016/7 capsule looks much more than twice as big as the puny little 2014/15 one, because it’s twice as high and twice as wide (and by implication from shading, twice as deep).  The first graph also commits the accounting sin of displaying a trend from total, nominal expenditures rather than real (ie, inflation-adjusted) per-capita expenditures.

The second one is not as bad, but the descending line to the left of the data points is a bit dodgy, as is the fact that the x-axis is different from the first graph even though the information should all be available.  Also, given that rebates are precisely not a component of Pharmac’s drug spend, the percentage is a bit ambiguous.  The graph shows total rebates divided by what would have been Pharmac’s “drug spend” in the improbable scenario that the same drugs had been bought without rebates. That is, in the most recent year, Pharmac spent $849 million on drugs. If rebates were $400m as shown in the first graph, the percentage in the second graph is something like ($400 million)/($400 million+$849 million)=32%.

More striking when you listen to the whole thing, though,  is how negative it is about New Zealand getting these non-public discounts on expensive drugs.  In particular, the primary issue raised is whether we’re getting better or worse discounts than other countries (which, indeed, we don’t know), rather than whether we’re getting good value for what we pay — which we basically do know, because that’s exactly what Pharmac assesses.  

Now, since the drug companies do want to keep their prices secret there must be some financial advantage to them in doing so, thus there is probably some financial disadvantage to someone other than them.   It’s possible that we’re in that group; that other comparable countries are getting better prices than we are. It’s also possible that we’re getting better prices than them.  Given Pharmac’s relatively small budget and their demonstrated and unusual willingness not to subsidise overpriced new drugs, I know which way I’d guess.

There are two refreshing aspects to the interactive, though.  First, it’s good to see explicit consideration of the fact that drug prices are primarily not a rich-country problem.   Second, it’s good to see something in the NZ mass media in favour of the principle that Pharmac can and should walk away from bad offers. That’s a definite change from most coverage of new miracle drugs and Pharmac.

July 6, 2018

Showing uncertainty with colour

From Claus Wilke on Twitter, using color to indicate uncertainty, based on data from before the 2016 US election.

The red:blue scale indicates who is ahead, and the grey:coloured scale indicates confidence.  There was lots of discussion about whether this is graying out the differences too much or not enough, and so on, but it’s an interesting idea.

May 23, 2018

Graph of the week

From the Herald (via @aw_nz on Twitter)

One of the features of pie charts is that it’s relatively hard to judge angles and compare segments. Still, if you get them wrong enough, people can tell.   For example, the taxes — the grey and orange wedges — are clearly more than half the circle, but the numbers add to only 43%.  Less dramatically, the 13% wedge for GST is larger than the 18% wedge for importer margin, and the 30% wedge for fuel excise is larger than the 35% wedge for refined fuel.  You don’t have to be very cynical to wonder whether it’s a coincidence that the tax components are being exaggerated. [update: you don’t, but you’d probably be wrong — see comments]

Here’s an accurate piechart, assuming the numbers are correct:

March 28, 2018

Cycling for work or play

Auckland Transport publish data from cycle counters on various bike paths. They’re most interested in trends over time (increasing) and perhaps in seasonal variation (more in summer).

Here’s a look at weekday vs weekend counts using data from the start of 2016 to now (click to embiggen).

There are some paths that are clearly used primarily by commuters, with more than twice the average traffic on a weekday vs weekend. There are also some that are mostly used at the weekend, such as Matakana, Upper Harbour, and Mangere Bridge.  And some, like the Lightpath, that get used all the time.

Note: while it’s great that Auckland Transport publishes these data, the data would be easier to reuse if the names they used for each counter were consistent over time (eg: “Tamaki Dr” vs “Tamaki Drive”, or “Nelson Street Lightpath Counter Cyclists” vs “Nelson Street Lightpath Cyclists”)


March 26, 2018

Accurate graphical rhetoric

This graph comes from the Twitter account of Jill Hennessy, Victoria’s Minister for Health.  It’s obviously intended to make a particular point — and one that’s politically supportive to her.  However, it’s actually a pretty good graph.

The baseline isn’t zero, but this is clearly an example where a zero baseline would be silly: zero is not a relevant value of the vaccination rate.  The 95% top line is also not arbitrary: it’s the government target for vaccination, chosen because it’s thought to be high enough for herd immunity even to measles.  Having the line break out of the box is done without distorting the numerical values.   I might want some earlier data than 2013 to see the trends under the previous government, but that’s not a terrible omission.

The causal attribution of the increase to the “No Jab No Play” laws — restricting kindergarten, preschool, and daycare attendance for kids who are missing vaccinations — is obviously less solid, but it’s not implausible.  And there are some regions of Victoria where rates are still low. And there’s obviously room to argue about whether the laws denying benefits and restricting preschool/kindergarten/daycare enrolment are worth it even if they were responsible. But the graph itself, unusually for something from a minister, isn’t bad.

February 19, 2018

Ihaka Lecture Series – live and live-streamed in March

The theme of this year’s Ihaka Lecture Series is “A thousand words: Visualising statistical data”. The distillation of data into an honest and compelling graphic is essential component of modern (data) science, and this year, we have three experts exploring different facets of data visualisation.

Each event begins at 6pm in the Large Chemistry Lecture Theatre, Building 301, 23 Symonds Street, Central Auckland, with drinks, nibbles and chat – just turn up – and the talks get underway at 6.30pm. Each one will be live-streamed – details will be on the info pages, the links to which are given below.

On March 7, Professor Dianne Cook from Monash University (right) looks at simple tools for helping to decide if the patterns you think you see in the data are really there. Details. Statschat interviewed Di last year about the woman behind the data work, and it was a very popular read. It’s here. Di’s website is here.

On March 14, Associate Professor Paul Murrell from the Department of Statistics, The University of Auckland (left) will embark on a daring statistical graphics journey featuring the BrailleR package for visually-impaired users, high-performance computing, te reo, and XKCD. Details. Paul was a student when R was being developed by Ross Ihaka and Robert Gentleman, and has been part of the R Core Development team since 1999.

On March 21, Alberto Cairo, the Knight Chair in Visual Journalism at the University of Miami (below right) teaches principles so we all become more critical and better informed readers of charts. This lecture is non-technical – if you have any journalist friends, let them know. Details. His website is here.

The series is named after Ross Ihaka, Associate Professor in the Department of Statistics at the  University of Auckland. Ross, along with Robert Gentleman, co-created R – a statistical programming language now used by the majority of the world’s practicing statisticians. It is hard to over-emphasise the importance of Ross’s contribution to our field, so we named this lecture series in his honour to recognise his work and contributions to our field in perpetuity.


February 16, 2018

Best places to retire?

There’s a fun visualisation in the Herald of best places in NZ to retire. Chris Knox’s design lets you adjust the relative importance of a set of factors, and also see which factors are responsible for a good or bad ranking for your favorite region. For nerds, he’s even put up the code and data.

If you play around with the sliders enough, you can get Dunedin or Christchurch to the top, but you can’t get Auckland or Wellington there. Since about 30% of people over 65 actually do live in those two cities, there’s presumably some important decision factors that are left out and that would make cities look better if they were put in.

There’s at least two sorts of factors. First, that many people live in cities. You might well want to retire somewhere close to your friends and whānau.  Second, that you want the amenities of a city: public transport, taxis, libraries, cinemas, museums, stadiums, fair-quality cheap restaurants.

The interactive is just for fun, but similar principles apply to serious decision-making tools.  The ‘best’ decision depends a lot on your personal criteria for ‘best’, and oversimplifying these criteria will give you something that looks like an objective, data-based policy choice, but really isn’t.

February 13, 2018

Opinions about immigrants

Ipsos MORI do a nice set of surveys about public misperceptions: ask a sample of people for their estimate of a number and compare it to the actual value.

The newest set includes a question about the proportion of the prison population than are immigrants. Here’s (a redrawing of) their graph, with NZ in all black.

People think more than a quarter of NZ prisoners are immigrants; it’s actually less than 2%. I actually prefer this as a ratio

The ratio would be better on a logarithmic scale, but I don’t feel like doing that today since it doesn’t affect the main point of this pointpost.

A couple of years ago, though, the question was about what proportion of the overall population were immigrants. That time people also overestimated a lot.  We can ask how much of the overestimation for the prison question can be explained by people just thinking there are more immigrants than there really are.

Here’s the ratio of the estimated proportion of immigrants among the prison population and the total population

The bar for New Zealand is to the left; New Zealand recognises that immigrants are less likely to be in prison than people born here. Well, the surveys taken two years apart are consistent with us recognising that, at least.

That’s just a ratio of two estimates. We can also compare to the reality. If we divide this ratio by the true ratio we find out how much more likely people think an individual immigrant is to end up in prison compared to how likely they really are.

It seems strange that NZ is suddenly at the top. What’s going on?

New Zealand has a lot of immigrants, and we only overestimate the actual number by about a half (we said 37%; it was 25% in 2017). But we overestimate the proportion among prisoners by a lot. That is, we get this year’s survey question badly wrong, but without even the excuse of being seriously deluded about how many immigrants there are.