What’s wrong with this picture?
So, I was on a plane from Sydney yesterday that was old enough they told us to switch off our books half an hour before landing. As a result, I actually looked at the Auckland information on the flight map channel (photo taken after we were allowed technology, naturally):
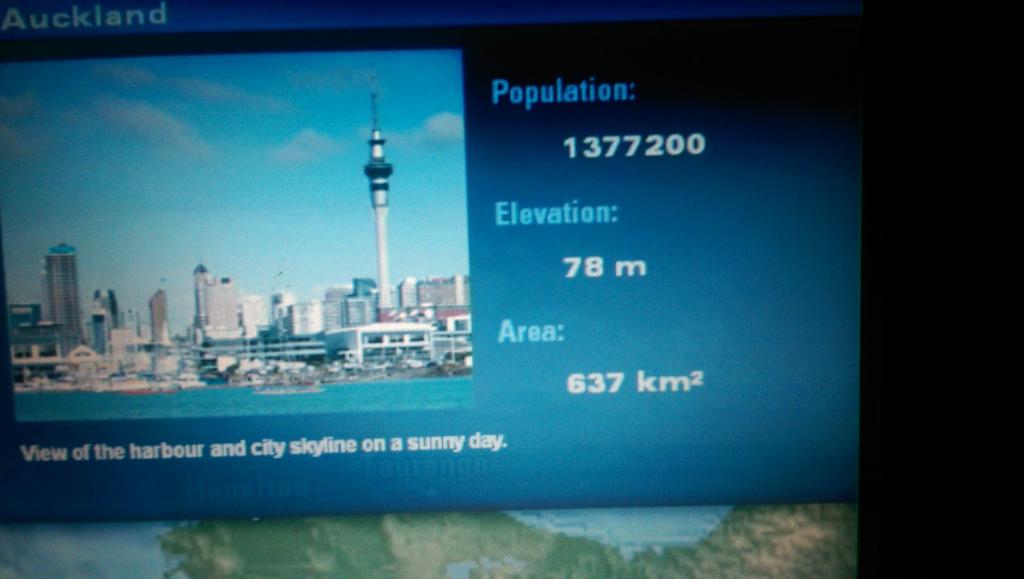
It’s interesting to see where these numbers come from, given all the different ways these things can be defined. Two of these numbers are inconsistent with each other and somewhat obsolete, and the third isn’t even wrong.
According to the Google, the population number 1,377,200 is the June 2011 estimate of the urban population of the Auckland metropolitan area. Ok, that’s a bit old but so was the plane. Slightly more strange is that StatsNZ thinks the urban Auckland population at 30 June 2011 was 1,351,200, but that’s probably a matter of projections being made in advance and then adjusted as more information comes in. The current (June 2014) estimate is 1,413,500.
So if the population is urban Auckland, what’s the area? With a bit of searching, you can find it’s the area of the old Auckland City, the central Auckland isthmus plus various islands. Auckland City had a population of 450,000 when it was absorbed into the Supercity in 2010. The population and area numbers are for very different entities, and the population number, although old, dates from after the area number became completely obsolete.
The area that goes with the 1,377,200 number is 1,102.9km2, the size of the Statistical Urban Area. You could reasonably want the urbanised area (483km2) or the Metropolitan Urban Limits (560km2) as better summaries of the size of Auckland, but they don’t match the quoted population.
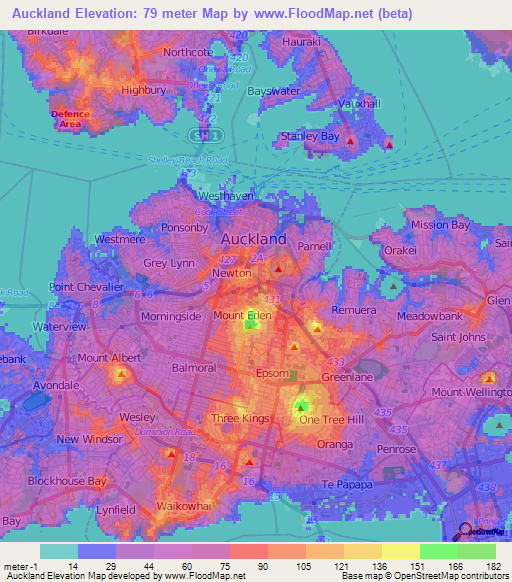
That leaves elevation. The picture next to the statistics shows that 78m is not a completely satisfactory characterisation of the elevation of Auckland. The blue stuff with boats floating on it is at sea level (up to tidal variation). Here’s a map (from FloodMap.net) of Auckland elevation; the change from pink to red is at 75m.
Overall, population and area, which could have multiple satisfactory definitions, are defined incompatibly with each other. Elevation doesn’t really have a satisfactory definition, but isn’t 78m.
Thomas Lumley (@tslumley) is Professor of Biostatistics at the University of Auckland. His research interests include semiparametric models, survey sampling, statistical computing, foundations of statistics, and whatever methodological problems his medical collaborators come up with. He also blogs at Biased and Inefficient See all posts by Thomas Lumley »
> Elevation doesn’t really have a satisfactory definition, but isn’t 78m.
How about…. *waves hands erratically*
The volume of “everything” above the reference geoid, possibly minus
anything mobile (either living or fluid), divided by the area of the geoid
that doesn’t intersect with a known body of saline solution.
Give or take a fudge-factor for caves, tunnels, overhanging cliffs, saline
aquifiers, and anything else that breaks my pretty model.
And with a fudge-factor to allow for the geoid not actually being flat.
Maybe just apply a flat-earth correction factor before calculating the
volume. :-)
9 years ago
That’s precise in principle, but I actually think 0m is a better definition. I’d certainly argue that the volcanoes, at least, are *above* the elevation of Auckland.
9 years ago