Posts from October 2011 (39)

October 21, 2011

Our RWC 2015 team was born in March 1987

Were you born between January and March in 1987? Congratulations – you’re picked for the RWC 2015 New Zealand team!

This rather ridiculous (and untrue) piece of information I just made up was concocted by examining some data and coming to an unsubstantiated conclusion. I was inspired to do this because I read recently in a British tabloid that one should “Give birth in March for a pilot” and “Victoria Beckham’s [daughter] likely to become bricklayer”. Finding the exact source of the study from the Office of National Statistics was troublesome but instead led me to a lot of advice for when to get pregnant so your child could be a dentist.

Without seeing the original study we cannot say what got twisted around between when the UK Census was collected and when the tabloids hit the news stands. The methodological insight that we get from the Daily Mail suggests that the monthly professions-of-choice are those “with the greatest percentage above the monthly average”. Well, pick a bunch of numbers and there will be a biggest one! It doesn’t necessarily condemn your January-born aspiring sheet-metal worker to the life of a GP.

A further concern arises from multiple comparisons. The more things you look for, the more “oddities” or coincidences you’ll find – none of them have to mean anything at all. Compare 19 professions against 12 months and that’s 228 chances to find something a little unusual. You’re sure to go away with a juicy collection of headlines for these pains. Even further, oddities in the statistical sense can be decidedly underwhelming in practical terms, if we are dealing with huge numbers of respondents as in the UK census. It might be statistically all-but-certain that “Spring birth conveys height advantage” but the height advantage in question turns out to be only 6 mm.

One place where we can see a real and well-studied effect from month of birth is sport. Sport is seasonal and, unlike dentistry, has a very clear starting time every year. If sports are organised by age-group and you are among the oldest in the group, you have almost a year’s advantage over the youngest. For children, a year is a big deal in terms of size, physical coordination, and maturity – and this advantage snowballs throughout childhood as you get picked for the best teams, practise more, play against better opponents, and on and on. Ad Dudink examined Dutch and English soccer players in 1994, following in the footsteps of Barnsley and Thompson who examined Canadian hockey players in 1985 and 1988.

As for whether you’ll be a dentist or a bricklayer, it is possible that this can be affected by birth month, because the age differential in the school year affects children’s academic outcomes in a similar (but less drastic) way to sports teams. In the UK, children start school in September, so September-born children have a year’s maturity advantage over their August-born classmates. This is not a temporary effect: studies have shown that the advantage/disadvantage continues to school-leaving exams and university.

In New Zealand our school season begins in February, so don’t expect the same education outcomes to birth month misconnections as the United Kingdom.

But how about them All Blacks?

I extracted the place and date of birth of each of the team members listed for the All Blacks and French teams from the Rugby World Cup 2011 website, which I then ran through sed, R and finally dumped into Excel.

Then I separated the players out into hemisphere of birth, as each hemisphere has a different season start. All the French players were born in the northern hemisphere, and all the All Blacks were born in the southern hemisphere, making my life a bit easier.

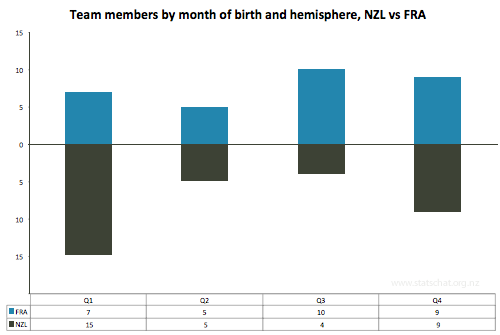
I’ve plotted them here. French (blue) above the equator, and All Blacks (black) below:

Graph of data

Team members by quarter of birth and hemisphere, NZL vs FRA

Eyeballing that does suggest some stories about when to be born if you want to play for the All Blacks or the French, but being born in January to March isn’t going to get you straight onto the All Black squad. There are many other factors that influence your selection:

Eat a healthy diet, high in Weet-Bix, exercise often, and most importantly, you can increase your chances of being on the squad by starting to play rugby.

A few references and citations for further reading:

^ Jessica Utts (2003). What Educated Citizens Should Know About Statistics and Probability. The American Statistician. May 1, 2003, 57(2): 74-79. doi:10.1198/0003130031630

^ Weber GW, Prossinger H, Seidler H (1998). Height depends on month of birth. Nature, 391(6669), 754-755 doi:10.1038/35781

^ Dudink A (1994). Birth date and sporting success. Nature, 368(6472), 592.

^ Barnsley RH, Thompson AH, Barnsley PE (1985). Hockey success and birth-date: The relative age effect. Journal of the Canadian Association for Health, Physical Education, and Recreation, Nov.-Dec., 23-28.

^ Barnsley RH, Thompson AH (1988). Birthdate and success in minor hockey: The key to the N.H.L.. Canadian Journal of Behavioral Science 20, 167-176.

Wiseman, R (2008). Quirkology: The Curious Science Of Everyday Lives, 28-29 ISBN: 9780330448093

Back in 2008 the All Black squad was also dominated by January – March births: http://rowansimpson.com/­2008/12/07/31-december/

October 20, 2011

The use of Bayes’ Theorem in jeopardy in the United Kingdom?

A number of my colleagues have sent me this link from British newspaper The Guardian, and asked me to comment. In some sense I have done this. I am a signatory to an editorial published in the journal Science and Justice which protests the law lords’ ruling.

The Guardian article refers to a Court of Appeal ruling in the United Kingdom referred to as R v T. The original charge against Mr. T. is that of murder and, given the successful appeal, his name is suppressed. The nature of the appeal relates to whether an expert is permitted to use likelihood ratios in provision of evaluative opinion, whether an evaluative opinion based on an expert’s experience is permissible, and whether it is necessary for an expert to set out in a report the factors on which evaluative opinion based.

It is worthwhile noting before we proceed that to judge a case solely on one aspect of the whole trial is dangerous. Most trials are complex affairs with many pieces of evidence, and much more testimony that the small aspects we concentrate on here.

The issue of concern to members of the forensic community is the following part of the ruling:

In the light of the strong criticism by this court in the 1990s of using Bayes theorem before the jury in cases where there was no reliable statistical evidence, the practice of using a Bayesian approach and likelihood ratios to formulate opinions placed before a jury without that process being disclosed and debated in court is contrary to principles of open justice.

The practice of using likelihood ratios was justified as producing “balance, logic, robustness and transparency”, as we have set out at [54]. In our view, their use in this case was plainly not transparent. Although it was Mr Ryder’s evidence (which we accept), that he arrived at his opinion through experience, it would be difficult to see how an opinion of footwear marks arrived at through the application of a formula could be described as “logical”, or “balanced” or “robust”, when the data are as uncertain as we have set out and could produce such different results.

A Bayesian, or likelihood ratio (LR) approach to evidence interpretation, is a mathematical embodiment of three principles of evidence interpretation given by Ian Evett and Bruce Weir in their book Interpreting DNA Evidence: Statistical Genetics for Forensic Scientist. Sinauer, Sunderland, MA 1998. These principles are

  1. To evaluate the uncertainty of any given proposition it is necessary to consider at least one alternative proposition
  2. Scientific interpretation is based on questions of the kind “What is the probability of the evidence given the proposition?”
  3. Scientific interpretation is conditioned not only by the competing propositions, but also by the framework of circumstances within which they are to be evaluated

The likelihood ratio is the central part of the odds form of Bayes’ Theorem. That is
Bayes' Theorem

The likelihood ratio gives the ratio of the probability of the evidence given the prosecution hypothesis to the probability of the evidence given the defense hypothesis. It is favoured by members of my community because it allows the expert to comment solely on the evidence, which is all the court has asked her or him to do.

The basis for the appeal in R v T was that the forensic scientist, Mr Ryder, in the first instance computed a likelihood ratio, but did not explicitly tell the court he had done so. In the second instance, there was also criticism that the data needed to evaluate the LR was not available.

Mr Ryder considered four factors in his evaluation of the evidence. These were the pattern, the size, the wear and the damage.

The sole pattern is usually the most obvious feature of a shoe mark or impression. Patterns are generally distinct between manufacturers and to a lesser extent between different shoes that a manufacturer makes. Mr Ryder considered the probability of the evidence (the fact that the shoe impression “matches” the impression left by the defendant’s shoe) if it indeed was his shoe that left it. It is reasonable to assume that this probability is one or close to one. If the defendant’s shoe did not leave the mark, then we need a way of evaluating the probability of a “adventitious” match. That is, what’s the chance that the defendant’s shoe just happened to match by sheer bad luck alone? A reasonable estimate of this probability is the frequency of the pattern in the relevant population. Mr Ryder used a database of shoe pattern impressions found at crime scenes. Given that this mark was found at a crime scene this seems a reasonable population to consider. In this database the pattern was very common with a frequency of 0.2. The defense made much stock of the fact that the database represented only a tiny fraction of the shoes produced in the UK in a year (0.00006 per cent), and therefore it was not comprehensive enough to make the evaluation. In fact, the defense had done its own calculation which was much more damning for their client. Using the 0.2 frequency gives a LR of 5. That is, the evidence is 5 times more likely if Mr T.’s shoe left the mark rather than a shoe of a random member of the population.

The shoe size is also a commonly used feature in footwear examination. The shoe impression was judged to be size 11. Again the probability of the evidence if Mr T.’s shoe left the mark was judged to be one. It is hard to work out exactly what Mr Ryder did from the ruling, because a ruling is the judges’ recollection of proceedings, which is not actually an accurate record of what may, or may not, have been said. According to the ruling, Mr Ryder used a different database to assess the frequency of size. He estimated this to be 3%. The judges incorrectly equate this to 0.333, instead of 0.03 which would lead to an LR of 33.3. Mr Ryder used a “more conservative” figure to reflect to some uncertainty in size determination to 0.1, giving an LR of 10.

Wear on shoes can be different between different people. Take a look at the soles of your shoes and those of a friend. They will probably be different. To evaluate the LR, Mr Ryder considered that the wear on the trainers. He felt could exclude half of the trainers of this pattern type and approximate size/configuration. He therefore calculated the likelihood ratio for wear as 1/0.5 or 2. Note here that Mr Ryder appears to have calculated the probability of wear given pattern and size.

Finally, Mr Ryder considered the damage to the shoes. Little nicks and cuts accumulate on shoes over time and can be quite distinctive. Mr Ryder felt he could exclude very few pairs of shoes that could not previously have been excluded by the other factors. That is the defendant’s shoes were no more, or less, likely to have left the mark than any other pair in the database that had the same pattern, size and wear features. Therefore therefore calculated the likelihood ratio for damage as 1.

The overall LR was calculated by multiplying the four LRs together. This is acceptable if either the features were independent, or the appropriate conditional probabilities were considered. This multiplication gave an LR of 100, and that figure was converted using a “verbal scale” into the statement “the evidence provides moderate support for the proposition that the defendant’s shoe left the mark.” Verbal scales are used by many forensic agencies who employ an LR approach because they are “more easily understood” by the jury and the court.

The appeal judges ruled that this statement, without the explicit inclusion of information explaining that it was based on an LR, was misleading. Furthermore, they ruled that the data used to calculate the LR was insufficient. I, and many of my colleagues, disagree with this conclusion.

So what are the consequences of this ruling? It remains to be seen. In the first instance I think it will be an opening shot for many defense cases in the same way that they try to take down the LR because it is “based on biased Bayesian reasoning.” I do think that it will force forensic agencies to be more open about their calculations, but I might add that Mr Ryder didn’t seek to conceal anything from the court. He was simply following the guidelines set out by the Association of Footwear, Tool marks, and Firearms Examiners guidelines.

It would be very foolish of the courts to dismiss the Bayesian approach. After all, Bayes’ Theorem simply says (in mathematical notation) that you should update your belief about the hypotheses based on the evidence. No judge would argue that against that.

October 18, 2011

Blackberry outage lowers accident rate in the UAE?

Quite a few websites are linking to an article in Abu Dhabi newspaper The National that reports claims a recent worldwide Blackberry service outage led to a 40% fall in the traffic accidents in Abu Dhabi and 20% in Dubai – although the police haven’t released the specific numbers. The suggestion is that people couldn’t use their devices while driving so weren’t suffering from accidents caused by distraction.

According to an earlier article in The National, there were approximately 320 traffic accidents a day in Abu Dhabi (116,487 in total) in 2009, or approximately one accident every 4.5 minutes. The current article claims that there is now an accident every 3 minutes in Abu Dhabi (320 a day, 175,200 a year).

Now these sort of numbers look impressive, but, as we have seen previously in a Thomas Lumley post about New Zealand’s accident figures, they can be a bit misleading.

The population of Abu Dhabi in 2009 was estimated to be 896,751. The estimated population of the emirate was put at around 1.643 million. Using the smaller figures, the accident rate is about 1 every 7 years, which as Thomas previously pointed out, sounds somewhat less impressive than one every 3 minutes.

To put the 2011 figures in perspective, we need an estimate of the current population size, which we don’t have – a census is due to be carried out this year. The population of Abu Dhabi is increasingly rapidly (in 1975 there were ~200,000 in the emirate). If we choose a conservative figure of 1 million, the accident rate has gone up a bit to one about every 5.7 years. If the 40% is real, and was applied to every day of the year, this figure would change to 1 accident in every 9.5 years.

Of course, not everyone in the population is a driver! 57% of the population is aged 15-64 (which totals 511,148 people), and in 2008 there were 676,660 drivers. The demographics of the United Arab Emirates (UAE), of which Abu Dhabi and Dubai are a part, are quite interesting. The male/female sex ratio (in the 15-65 age group) is highly skewed at 2.743, or approximately 73.3% male and 26.7% female, and according to this article only 15% of drivers (in Dubai) with licenses are females. So let’s look at this again. In 2008 there were 116,487 accidents amongst approximately 676,660 drivers which works out to be 0.17 accidents per driver for the year, or 1 every 5.8 years. The rates are undoubtedly different for males and females.

What can we say from all this? Not a lot, but even if the dip in traffic accidents is real, it is unlikely to have a major effect on the annual total.

Rugger on the radio

David Scott of the Department of Statistics at The University of Auckland was on Radio New Zealand this morning discussing his predictions for the final on Sunday between the All Blacks and Les Bleus    …

Predictions for RWC 2011 Finals

Ratings at the Start of RWC 2011

Here are the team ratings at the start of RWC 2011.

Rating
New Zealand 30.92
Australia 22.97
South Africa 20.50
England 13.19
France 11.42
Wales 9.99
Ireland 8.65
Argentina 6.42
Scotland 4.50
Italy -2.78
Samoa -7.38
Canada -15.03
Tonga -15.11
Fiji -15.70
Japan -22.52
Georgia -25.35
USA -27.29
Romania -28.18
Russia -33.12
Namibia -38.21


Current Team Ratings

Here are the team ratings for the finalists as of October 17, 2011

Rating
New Zealand 30.88
Australia 21.57
Wales 14.84
France 10.38


There has been no change in the ratings for Australia and New Zealand after the semi-finals because that result was predicted very accurately. France’s rating has increased by half a point and Wales’ decreased by the same amount as a result of their match. Surprisingly France’s rating has dropped a point since the start of the tournament, yet they are in the final. That is mostly due to the 5 point loss to Tonga where the prediction was they should win by 25 points. Their rating also dropped as a result of the Japan game.

Performance So Far

So far there have been 46 matches played, 40 of which were correctly predicted, a success rate of 87%.

Here are the predictions for the games so far.

Game Date Score Prediction Correct
1 New Zealand vs. Tonga Sep 09 41 – 10 51.03 TRUE
2 Argentina vs. England Sep 10 9 – 13 -6.77 TRUE
3 Fiji vs. Namibia Sep 10 49 – 25 22.51 TRUE
4 France vs. Japan Sep 10 47 – 21 33.94 TRUE
5 Scotland vs. Romania Sep 10 34 – 24 32.68 TRUE
6 Australia vs. Italy Sep 11 32 – 6 25.75 TRUE
7 Ireland vs. USA Sep 11 22 – 10 35.93 TRUE
8 South Africa vs. Wales Sep 11 17 – 16 10.51 TRUE
9 Samoa vs. Namibia Sep 14 49 – 12 30.95 TRUE
10 Scotland vs. Georgia Sep 14 15 – 6 28.04 TRUE
11 Tonga vs. Canada Sep 14 20 – 25 1.53 FALSE
12 Russia vs. USA Sep 15 6 – 13 -7.75 TRUE
13 New Zealand vs. Japan Sep 16 83 – 7 56.20 TRUE
14 Argentina vs. Romania Sep 17 43 – 8 33.00 TRUE
15 Australia vs. Ireland Sep 17 6 – 15 16.26 FALSE
16 South Africa vs. Fiji Sep 17 49 – 3 35.32 TRUE
17 England vs. Georgia Sep 18 41 – 10 36.79 TRUE
18 France vs. Canada Sep 18 46 – 19 25.29 TRUE
19 Wales vs. Samoa Sep 18 17 – 10 17.64 TRUE
20 Italy vs. Russia Sep 20 53 – 17 30.27 TRUE
21 Tonga vs. Japan Sep 21 31 – 18 9.44 TRUE
22 South Africa vs. Namibia Sep 22 87 – 0 59.41 TRUE
23 Australia vs. USA Sep 23 67 – 5 46.40 TRUE
24 England vs. Romania Sep 24 67 – 3 39.03 TRUE
25 New Zealand vs. France Sep 24 37 – 17 24.98 TRUE
26 Argentina vs. Scotland Sep 25 13 – 12 5.63 TRUE
27 Fiji vs. Samoa Sep 25 7 – 27 -10.39 TRUE
28 Ireland vs. Russia Sep 25 62 – 12 42.28 TRUE
29 Wales vs. Namibia Sep 26 81 – 7 50.92 TRUE
30 Canada vs. Japan Sep 27 23 – 23 9.11 FALSE
31 Italy vs. USA Sep 27 27 – 10 24.34 TRUE
32 Georgia vs. Romania Sep 28 25 – 9 5.16 TRUE
33 South Africa vs. Samoa Sep 30 13 – 5 28.08 TRUE
34 Australia vs. Russia Oct 01 68 – 22 56.36 TRUE
35 England vs. Scotland Oct 01 16 – 12 12.96 TRUE
36 France vs. Tonga Oct 01 14 – 19 25.06 FALSE
37 Argentina vs. Georgia Oct 02 25 – 7 28.92 TRUE
38 Ireland vs. Italy Oct 02 36 – 6 12.30 TRUE
39 New Zealand vs. Canada Oct 02 79 – 15 50.88 TRUE
40 Wales vs. Fiji Oct 02 66 – 0 28.95 TRUE
41 Ireland vs. Wales Oct 08 10 – 22 -3.92 TRUE
42 England vs. France Oct 08 12 – 19 4.87 FALSE
43 South Africa vs. Australia Oct 09 9 – 11 -0.20 TRUE
44 New Zealand vs. Argentina Oct 09 33 – 10 31.00 TRUE
45 Wales vs. France Oct 15 8 – 9 5.49 FALSE
46 New Zealand vs. Australia Oct 16 20 – 6 14.37 TRUE


Predictions for the Finals

Here are the predictions for the finals

Game Date Winner Prediction
1 Wales vs. Australia Oct 21 Australia -6.70
2 New Zealand vs. France Oct 23 New Zealand 25.50


October 17, 2011

Stat of the Week Winner: October 8-14 2011

Thanks for all the nominations this week. We’ve selected Eric Crampton’s nomination of a “mutant statistic” to be this week’s winner:

Here’s TVNZ’s quote: “Australia’s Cancer Council said the Senate should end the political delays and get on with passing the legislation, with authorities estimating smoking now kills 15,000 Australians each year and costs the health system $32 billion.”

The $32 billion figure comes from Collins & Lapsley’s report on the social costs of alcohol, tobacco, and other drugs.

Most importantly, $32 billion figure counts a host of tangible and intangible costs that fall on the smoker, those around the smoker, and the public health system. Only $312 million of the $32 billion, according to the report, counts as a net health cost. Just look at the first table at xii in the Executive Summary.

I get really really annoyed at how these big numbers, which mostly consist of costs borne by the smoker or drinker himself, get twisted by activists like the Cancer Council to build support for policies that further beat on smokers and drinkers. There can be a case for anti-smoking policy. But it oughtn’t be based on lies. Smokers pay more in tax than they cost the health system in any country that has a reasonably large tobacco tax and a reasonably large public pension system.

This is a classic example of using the wrong definition for a figure (we noted the table said $318.4 million rather than $318 million) – a common problem with statistics – and $32 billion is rather different from $318 million!

Stat of the Week Competition: October 15-21 2011

Each week, we would like to invite readers of Stats Chat to submit nominations for our Stat of the Week competition and be in with the chance to win an iTunes voucher.

Here’s how it works:

  • Anyone may add a comment on this post to nominate their Stat of the Week candidate before midday Friday October 21 2011.
  • Statistics can be bad, exemplary or fascinating.
  • The statistic must be in the NZ media during the period of October 15-21 2011 inclusive.
  • Quote the statistic, when and where it was published and tell us why it should be our Stat of the Week.

Next Monday at midday we’ll announce the winner of this week’s Stat of the Week competition, and start a new one.

The fine print:

  • Judging will be conducted by the blog moderator in liaison with staff at the Department of Statistics, The University of Auckland.
  • The judges’ decision will be final.
  • The judges can decide not to award a prize if they do not believe a suitable statistic has been posted in the preceeding week.
  • Only the first nomination of any individual example of a statistic used in the NZ media will qualify for the competition.
  • Employees (other than student employees) of the Statistics department at the University of Auckland are not eligible to win.
  • The person posting the winning entry will receive a $20 iTunes voucher.
  • The blog moderator will contact the winner via their notified email address and advise the details of the $20 iTunes voucher to that same email address.
  • The competition will commence Monday 8 August 2011 and continue until cancellation is notified on the blog.

Stat of the Week Nominations: October 15-21 2011

If you’d like to comment on or debate any of this week’s Stat of the Week nominations, please do so below!

October 16, 2011

Less birds is a good thing?

According to the Dominion Post Environment Minister Nick Smith said the clean-up effort and the reduced number of dying birds was encouraging, with regards to New Zealand’s worst environmental disaster with the grounding of Rena on the Astrolabe Reef.

Although at first glance a reduced number of dying birds may appear to be a good thing, the underlying process driving this trend is not clear. It could be that most birds at risk to the oil spill have already died, and the reduced number of dying birds is in fact because there are no more birds alive left to die.

Statistically, what are confounded here are the population size and the probabilities of detection and impact (from the oil spill). When the total number of birds being found dead has declined, we don’t know if the population size has remained relatively stable, but the number being detected and impacted has declined, or if the population size has declined, but the number being detected and impacted has remained constant. In both cases the calculation of the absolute number of birds being recovered comes out the same, but under the first scenario, the impact of the oil spill has declined, whereas in the second, the oil spill is having the same impact.

I hope for the sake of the birds it is the first scenario, as Nick Smith hopes, because as Minister of Conservation Kate Wilkinson says, “it’s not their fault.”

October 15, 2011

Semi-Final Predictions for RWC 2011

Current Team Ratings

Here are the team ratings for the semi-finalists as of October 10, 2011.

Rating
New Zealand 30.91
Australia 21.54
Wales 15.35
France 9.86


There has not been much change in the ratings as a result of the Quarter Final games. Wales and France have each improved their rating by about a point. The All Blacks have gone down by half a point.

Performance So Far

So far there have been 44 matches played, 39 of which were correctly predicted, a success rate of 88.6%.

Here are the predictions for the games so far.

Game Date Score Prediction Correct
1 New Zealand vs. Tonga Sep 09 41 – 10 51.03 TRUE
2 Argentina vs. England Sep 10 9 – 13 -6.77 TRUE
3 Fiji vs. Namibia Sep 10 49 – 25 22.51 TRUE
4 France vs. Japan Sep 10 47 – 21 33.94 TRUE
5 Scotland vs. Romania Sep 10 34 – 24 32.68 TRUE
6 Australia vs. Italy Sep 11 32 – 6 25.75 TRUE
7 Ireland vs. USA Sep 11 22 – 10 35.93 TRUE
8 South Africa vs. Wales Sep 11 17 – 16 10.51 TRUE
9 Samoa vs. Namibia Sep 14 49 – 12 30.95 TRUE
10 Scotland vs. Georgia Sep 14 15 – 6 28.04 TRUE
11 Tonga vs. Canada Sep 14 20 – 25 1.53 FALSE
12 Russia vs. USA Sep 15 6 – 13 -7.75 TRUE
13 New Zealand vs. Japan Sep 16 83 – 7 56.20 TRUE
14 Argentina vs. Romania Sep 17 43 – 8 33.00 TRUE
15 Australia vs. Ireland Sep 17 6 – 15 16.26 FALSE
16 South Africa vs. Fiji Sep 17 49 – 3 35.32 TRUE
17 England vs. Georgia Sep 18 41 – 10 36.79 TRUE
18 France vs. Canada Sep 18 46 – 19 25.29 TRUE
19 Wales vs. Samoa Sep 18 17 – 10 17.64 TRUE
20 Italy vs. Russia Sep 20 53 – 17 30.27 TRUE
21 Tonga vs. Japan Sep 21 31 – 18 9.44 TRUE
22 South Africa vs. Namibia Sep 22 87 – 0 59.41 TRUE
23 Australia vs. USA Sep 23 67 – 5 46.40 TRUE
24 England vs. Romania Sep 24 67 – 3 39.03 TRUE
25 New Zealand vs. France Sep 24 37 – 17 24.98 TRUE
26 Argentina vs. Scotland Sep 25 13 – 12 5.63 TRUE
27 Fiji vs. Samoa Sep 25 7 – 27 -10.39 TRUE
28 Ireland vs. Russia Sep 25 62 – 12 42.28 TRUE
29 Wales vs. Namibia Sep 26 81 – 7 50.92 TRUE
30 Canada vs. Japan Sep 27 23 – 23 9.11 FALSE
31 Italy vs. USA Sep 27 27 – 10 24.34 TRUE
32 Georgia vs. Romania Sep 28 25 – 9 5.16 TRUE
33 South Africa vs. Samoa Sep 30 13 – 5 28.08 TRUE
34 Australia vs. Russia Oct 01 68 – 22 56.36 TRUE
35 England vs. Scotland Oct 01 16 – 12 12.96 TRUE
36 France vs. Tonga Oct 01 14 – 19 25.06 FALSE
37 Argentina vs. Georgia Oct 02 25 – 7 28.92 TRUE
38 Ireland vs. Italy Oct 02 36 – 6 12.30 TRUE
39 New Zealand vs. Canada Oct 02 79 – 15 50.88 TRUE
40 Wales vs. Fiji Oct 02 66 – 0 28.95 TRUE
41 Ireland vs. Wales Oct 08 10 – 22 -3.92 TRUE
42 England vs. France Oct 08 12 – 19 4.87 FALSE
43 South Africa vs. Australia Oct 09 9 – 11 -0.20 TRUE
44 New Zealand vs. Argentina Oct 09 33 – 10 31.00 TRUE

Predictions for the Semi-Finals

Here are the predictions for the semi-final games

Game Date Winner Prediction
1 Wales vs. France Oct 15 Wales 5.50
2 New Zealand vs. Australia Oct 16 New Zealand 14.40