Posts from January 2012 (29)

January 19, 2012

This is your media on “drugs”

You may believe, Gentle Reader, that this blog is entirely negative towards stories about drugs.  That’s because the relationship between numbers and conclusions is often seriously overstated, if not completely made up.    An illustrative example is today’s story in the Herald.  Apart from the statistics, this is a reasonable story.  It has information based on actual measurements, and comments from two people who know what they are talking about, one of whom is independent of the data source. Unfortunately, the story is let down by the statistics.

Police and ESR actually grew some cannabis from high-quality seized material, and measured the THC concentration, comparing the results to when they did the same exercise in 1996.  This is potentially a fair comparison, although the sample size is small.  Unfortunately, they reported the mean (6%) from 1996 and the range (4.35%-25.3%) from the recent study, so the conclusion in the headline “Dope quadruples in THC strength” is not actually supported by the article. The growing study wasn’t even that recent — it ran from 2004 to 2006 — making the support for the headline even more dubious.   It’s not that the headline is intrinsically improbable, if growing has largely moved indoors and changed to modern strains, but we aren’t given any evidence.

The comment by Detective Sergeant Miller that “We are not seeing poor quality cannabis. It’s all good quality” is interesting.  In the US, according to Stanford expert Keith Humphreys, that isn’t the case: there is a lot of cheap, low-grade cannabis, and a smaller amount of boutique high-grade stuff.

Robin Ross Bell, from the Drug Foundation, makes the important point that we don’t actually know if higher concentrations of THC are more dangerous  — people may just use less when it’s strong.  This is especially true since smoking gives immediate feedback on dose, and we do know that tobacco smokers get about the same nicotine dose from varying nicotine concentrations in cigarettes.  It’s encouraging that there is actual research being done on this topic.

[Updated: Sorry about the name error].
January 18, 2012

Who you gonna call? part 2

Nate Silver, at the fivethirtyeight blog at the New York Times, writes

On Saturday, a survey came out showing Mitt Romney with a large, 21-point lead in South Carolina. The poll is something of an outlier relative to other recent polls of the state, all of which show Mr. Romney ahead, but by margins ranging from 2 to 9 points.

The poll, conducted by Ipsos for Reuters, has already attracted more than 200 citations in the mainstream media. Most of these articles, however, neglected to mention a key detail: in a break with Ipsos’ typical methodology, the survey was conducted online….

He goes on to give a good description of the problems with online polling and how the results match up to other techniques in election polls, where there is good evidence of comparability.  These online polls aren’t the `unscientific’ (aka ‘bogus’ web page surveys) we’ve complained about before, they are from polling companies who are at least trying to look accurate.

What Nate Silver doesn’t discuss further is the very large media coverage received by the anomalous poll. If you want election nerds to take you seriously it helps to get the same results as the other polls, but if you want to be newsworthy, it’s better to get very different results.  And since Mr Romney is highly likely to win the presidential nomination, an error that overestimates his popularity will be forgotten in the long run.

Journalism warning labels

Tom Scott has warning labels for newspaper articles (via Luis Apiolaza)

Oooh. Pretty.

David Sparks has some nice maps of public opinion, using transparency to indicate the level of uncertainty.

Compare to my cruder county-level versions, based on plotting a sample of several thousand from the population

January 17, 2012

Internet eats your brains!

Stuff is telling us “internet overuse could cause brain damage”, with even less than usual in the way of referencing: no journal, no researcher names, no university (no, “Chinese” is not sufficiently specific. There’s quite a few Chinese scientists out there).  Fortunately, the Google is always there to help, and it turns out that the relevant paper is available online, free, in PLoS One.

The first thing to note is that the paper says nothing about the effects of amount of internet use. Nothing.  It’s about internet addiction, which is at least trying to be a pathological condition distinct from just using the internet a lot.   Secondly, although the paper does claim to find “changes” in brain structure,  the participants had MRI brain imaging only once, so there is no data about changes.  What the researchers found is differences in brain structure between people with and without internet addiction, similar to the differences in people addicted to other things.

This immediately raises the question of cause and effect.  Is your brain different because you are addicted, or are you addicted because your brain is different?

Interestingly, the paper claims that ” the incidence rate of internet addiction among Chinese urban youths is about 14%“.  This seems implausibly high, and it’s twice the prevalence found in a recent Hong Kong survey  published in the British Journal of Psychiatry, but I suppose if the diagnostic criteria are still a bit fuzzy you would expect overdiagnosis in a large-scale survey.

January 16, 2012

Dragon Baby Boom?

Local media have been discussing the Chinese year of the dragon which starts on January 23rd and comes around every twelve years:

“Many Chinese consider the Year of the Dragon to be the most auspicious year to have a child. Those born under the sign of the dragon – the fifth, and the mightiest of the 12 Chinese zodiac signs – are said to be outstanding, driven, independent and destined for success.

[Feng shui practitioner] Mrs Chan said there would definitely be a spike in the number of Chinese mothers in New Zealand giving birth, but did not believe the numbers were large enough to affect hospitals or the health system.”

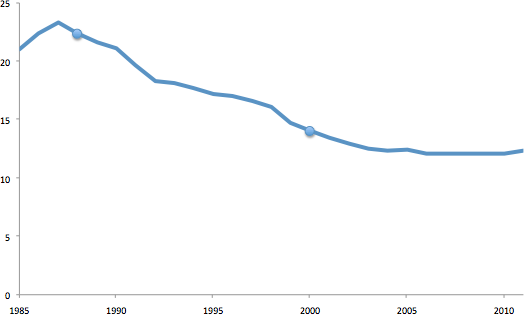
Out of curiosity, I had a look at the birth rate statistics (births per 1,000 population) for China:

The two dots indicate the year of the Dragon – no a year of the dragon spike at all.

I couldn’t get detailed enough statistics on birth rates for women of Asian descent in New Zealand – they were grouped together over a period of years.

However, researchers have found a (small) year of the Dragon effect on birth rates in other Asian countries – their paper on the subject and its history is fascinating.

Here’s an example in Hong Kong:

They conclude:

“birth rate rise in the Dragon Year is due to changes in timing of births that will have little effect on cumulative fertility.”

I would have liked to have seen some numbers about the “spikes” mentioned in the news stories to give context to how big this effect is (or isn’t).

Midas in Hollywood

Today’s topic is not precisely statistics, but the ability to do simple arithmetic and look up facts online are useful statistical skills.

At the Golden Globes awards, the dessert at dinner was sprinkled with edible gold flakes “at US$135 per gram”. This led to descriptions like “untrammeled excess” and “a dessert that is literally as difficult to acquire as gold dust”. Journalists don’t seem to have enquired as to how difficult or expensive it is to acquire gold dust. Obviously they don’t remember Goldschlager — the vile cinnamon schnapps with gold flakes popular in the 1990s — which is quite possible, given its after-effects.

One of the distinguishing features of gold is its ability to be hammered very, very thin.  A gram of gold can make a square metre of gold leaf. So, at gold-bullion prices, a 10cm x 10cm sheet of gold leaf, to cover an entire plate, would cost less than a couple of dollars. A 1cm x 1cm piece, enough to make some impressive gold flakes, would be a couple of cents. And in fact, culinary gold leaf is available at close to bullion prices: Amazon.com is out of stock at the moment, I found a British supplier that sells 8cm x 8cm leaves for 66p each (in packs of 25). Culinary gold is cheaper per serving than, say, saffron, which wouldn’t have excited any comment.

The gold flakes would be cheap compared to the ‘fresh berries’ (in mid-winter) in the dessert and not even a rounding error compared to the vintage champagne (Moet & Chandon 2002) served with it.

I’m sure there are better uses for the money spent on the Golden Globe awards, but the cost of gold flakes is just so not the issue.  The campaigners and reporters are making the same mistake that the TV ads for investment gold want you to make: to forget, like King Midas, that gold is just another  commodity metal.

January 14, 2012

Truth vigilantes?

The New York Times public editor (a position previously called ‘ombudsman’) has asked whether the paper should be a `truth vigilante’

I’m looking for reader input on whether and when New York Times news reporters should challenge “facts” that are asserted by newsmakers they write about.

I don’t know whether it’s encouraging that they are considering this, or discouraging that they need to.


January 13, 2012

Drug driving: dodgy numbers in a good cause?

More than a year ago, ESR scientists produced a report on drugs and alcohol found in blood samples taken after fatal crashes.  Now, the Drug Foundation is launching a publicity campaign using the data.  Their website says “Nearly half of drivers killed on New Zealand roads are impaired by alcohol, other drugs, or both.” But that’s not what the ESR report found. [Edited to add: the Drug Foundation is launching a campaign, but the TV campaign isn’t from them, it’s from NZTA]

The ESR report defined someone as impaired by alcohol if they had blood alcohol greater than 0.03%, and said they tested positive for other drugs if the other drugs were detectable.   If you look at the report in more detail, although 351/1046 drivers had detectable alcohol in their blood, only 191/1046 had more than 0.08%.  At 0.03% blood alcohol concentration there may well be some impairment of driving, and near 0.08% there’s quite a lot, but we can’t attribute all those crashes to alcohol impairment rather than inexperience, fatigue, bad luck, or stupidity.  At least the blood alcohol concentrations are directly relevant to impairment.  An assay for other drugs can be positive long after the actual effect wears off. For example, a single use of cannabis will show up in a blood test for 2-3 days, and regular use for up to a week.  In  fact, the summary of the ESR report specifically warns “Furthermore, it is important to acknowledge that the presence of drugs and alcohol in the study samples does not necessarily infer significant impairment.”   Regular pot smokers who are scrupulously careful not to drive while high would still show up as affected by drugs in the ESR report.  In fact, the Drug Foundation makes this distinction when they talk about random roadside drug testing, pointing out the advantages of a test of actual impairment over a test of any presence of a drug.

The Drug Foundation also did a survey of community attitudes to driving while on drugs (also more than a year ago), and it is interesting how many people think that stimulants and cannabis don’t impair their driving.  However, if you look at the survey, it turns out that it was an online poll, and “Respondents were recruited to the online survey via an advertising and awareness campaign that aimed to stimulate interest and participation in the study.” Not surprisingly, younger people were over-represented “The mean age of respondents was 38.1 years”, as were people from Auckland and Wellington. Maori, Pasifika, and Asians were all under-represented.  36% of respondents had used cannabis in the past year, more than twice the proportion in the Kiwi population as a whole.  No attempt was made to standardise to the whole NZ population, which is the fundamental step in serious attempts at accurate online polling.  [If we could use the data as a teaching example, I’d be happy to do this for them and report whether it makes any difference to the conclusions]

And while it’s just irritating that news websites don’t link to primary sources, it is much less excusable that the Drug Foundation page referencing the two studies doesn’t provide links so you can easily read them. The study reports are much more carefully written and open about the limitations of the research than any of the press releases or front-line website material.[The NZTA referencing is substantially less helpful]

For all I know, the conclusions may be broadly correct. I wouldn’t be at all surprised if many drug users do believe silly things about their level of impairment. Before  the decades of advertising and enforcement, a lot of people believed silly things about the safety of drunk driving.  And the new TV ads are clever, even if they aren’t as good as the ‘ghost chips’ ad.  But the numbers used to advertise the campaign don’t mean what the people providing the money say they mean.  That’s not ok when it’s politicians or multinational companies, and it’s still not ok when the campaigners have good intentions. [Edited to add: I think this last sentence still stands, but should be directed at least equally at the NZTA].


[Update: Media links: TVNZ,  3 News, Stuff, NZ Herald, Radio NZ]

January 12, 2012

Who you gonna call?

Keith Humphreys, an addiction researcher at Stanford, writes The newest Behavioral Risk Factors Surveillance System survey by the US CDC shows a substantially higher rate of binge drinking than in past surveys.  BRFSS is the world’s largest telephone survey, and in 2009 they started calling cellphones for the first time.

Cellphone users, and especially those who don’t have any landline phone, are a lot younger on average than the rest of the population.  That in itself need not be disastrous for surveys, since we know what proportion of the population is in each age group, and can rescale the numbers to remove the bias.  The problem is that cellphone users also are different in other ways that are harder to measure, as the CDC’s experience shows.