Posts from July 2012 (55)

July 23, 2012

Stat of the Week Competition: July 21 – 27 2012

Each week, we would like to invite readers of Stats Chat to submit nominations for our Stat of the Week competition and be in with the chance to win an iTunes voucher.

Here’s how it works:

  • Anyone may add a comment on this post to nominate their Stat of the Week candidate before midday Friday July 27 2012.
  • Statistics can be bad, exemplary or fascinating.
  • The statistic must be in the NZ media during the period of July 21 – 27 2012 inclusive.
  • Quote the statistic, when and where it was published and tell us why it should be our Stat of the Week.

Next Monday at midday we’ll announce the winner of this week’s Stat of the Week competition, and start a new one.

(more…)

Stat of the Week Competition Discussion: July 21 – 27 2012

If you’d like to comment on or debate any of this week’s Stat of the Week nominations, please do so below!

July 21, 2012

Best practice guidelines: a worked example

Stuff has a headlineLiving by the sea is good for your health” (with the page title “Life’s a beach”). The story starts

Sick people have been sent to the seaside for centuries and now a study has proven that living by the coast is good for your health.

Let’s see how it rates against the guidelines

(more…)

Best-practice guidelines for science reporting

These are from the UK Science Media Centre, part of its submission to the Leveson Inquiry

  • State the source of the story – e.g. interview, conference, journal article, a survey from a charity or trade body, etc. – ideally with enough information for readers to look it up or a web link.
  •  Specify the size and nature of the study – e.g. who/what were the subjects, how long did it last, what was tested or was it an observation? If space, mention the major limitations.
  • When reporting a link between two things, indicate whether or not there is evidence that one causes the other.
  • Give a sense of the stage of the research – e.g. cells in a laboratory or trials in humans – and a realistic time-frame for any new treatment or technology.
  •  On health risks, include the absolute risk whenever it is available in the press release or the research paper – i.e. if ’cupcakes double cancer risk’ state the outright risk of that cancer, with and without cupcakes.
  •  Especially on a story with public health implications, try to frame a new finding in the context of other evidence – e.g. does it reinforce or conflict with previous studies? If it attracts serious scientific concerns, they should not be ignored.
  •  If space, quote both the researchers themselves and external sources with appropriate expertise. Be wary of scientists and press releases over-claiming for studies.
  • Distinguish between findings and interpretation or extrapolation; don’t suggest health advice if none has been offered.
  •  Remember patients: don’t call something a ’cure’ that is not a cure.
  • Headlines should not mislead the reader about a story’s contents and quotation marks should not be used to dress up overstatement

This blog would be a lot less interesting (except to rugby fans) if the media followed these guidelines.  I think the second-last item is the only one that hasn’t been the basis for one or more posts.     (via)

One of these countries is different

You will have heard about the terrible shootings in Colorado.

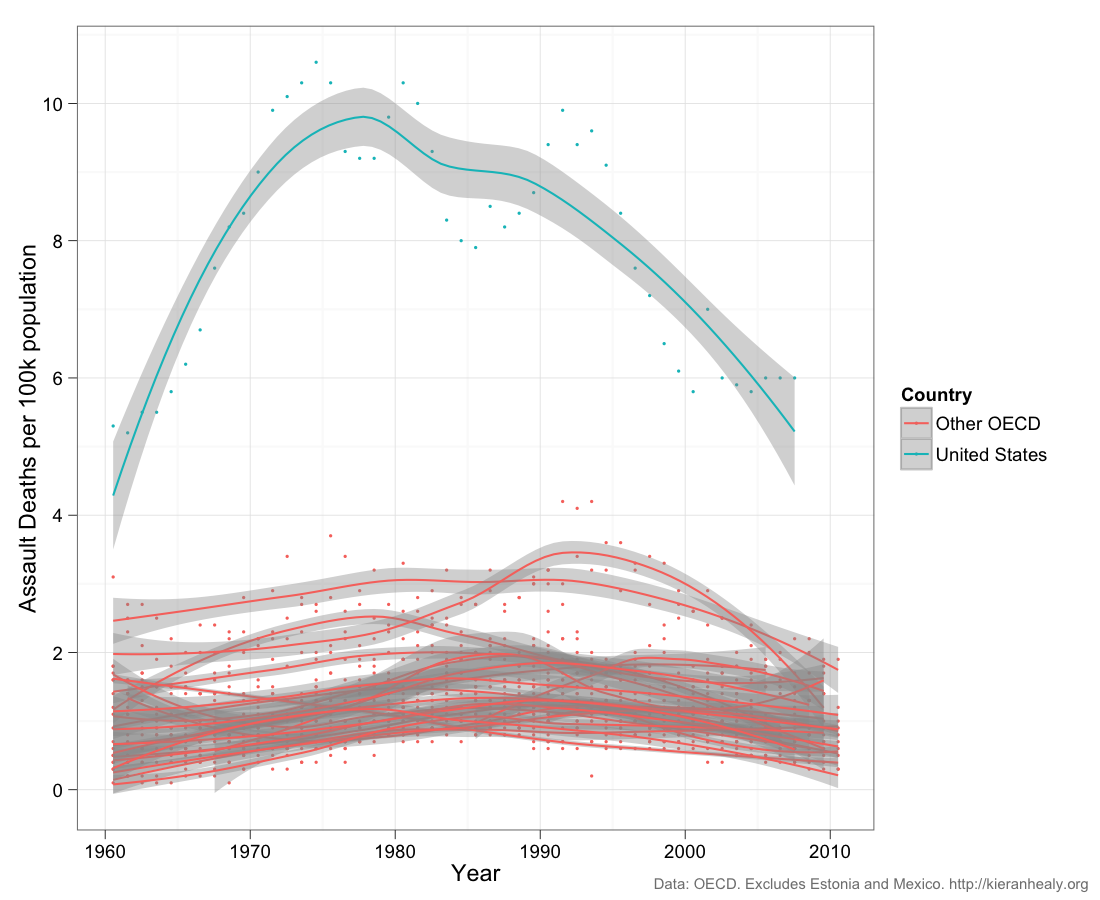
From a post by Kieran Healy, at Crooked Timber, responding to the tragedy: death rates from assault, per 100,000 population per year, for the US and 19 other OECD countries.  New Zealand is roughly in the middle (his post gives separate plots for each country).  Dots are the data for individual years, the curves are smoothed trends with margin of error.

The much higher rate in the US is obvious, but so is the decline.


Part of the decline is attributable to better medical treatment, so that assault victims are less likely to die, but far from all of it.  The rate of reports of aggravated assault is also down over the same time period.  Similarly, simple explanations like gun availability probably contribute but can’t explain the whole pattern.

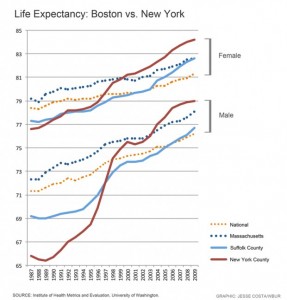
The decline in violent deaths is so large that it shows up in life expectancy comparisons.  New York, and especially Manhattan, used to have noticeably worse life expectancy than Boston, but the falling rate of violent deaths and the improvements in HIV treatment now put Manhattan, and the rest of New York City, at the top of US life expectancy

July 20, 2012

Measurement error and rare events

Surveys are not perfect: some people misunderstand the question, some people recall incorrectly, some responses are written down incorrectly by the poller, and some people just lie.   These biases happen in both directions, but their impact is not symmetrical.

Suppose you had a survey that asked “Have you ever been abducted by aliens?”  We can be sure that false ‘Yes’ results will be more common than false ‘No’ results, so the survey will necessarily overestimate the true proportion. If you wrote down the wrong answer for 1% of people, you’d end up with an estimate that was 1% too high.

In principle, the same issue  could be a serious problem in estimating the support for minor parties: about 1% of people voted for ACT at the last election, and 99% didn’t.  Suppose you poll 10000 people and ask them if they voted for ACT, and suppose that 100 of them really were ACT voters. If your opinion poll gets the wrong answer, randomly, for 1% of people, you will get the wrong answer from 1 of the true ACT voters, and 99 of the true non-ACT voters, so you will report 100+99-1=198 ACT voters and 9900+1-99 = 9802 non-ACT voters.  You would overestimate the votes for ACT by a factor of two!  Keith Humphreys, who we have linked to before, postulates that this is why US polls indicating support for a third-party candidate tend to seriously overestimate their support.

I’m skeptical.  Here in NZ, where we really have minor parties, there is no systematic tendency to overestimate the support they receive.  ACT got 1% of the vote, and that was close to what the polls predicted. Similarly, the Maori Party, and the Greens received about the same number of votes in the last election as averages of the polls had predicted.  For NZ First, the election vote was actually higher than in the opinion polls.  Similarly, for the Dutch general election in 2010 there was pretty good agreement between the last polls and the election results.  Even in Australia, where there is effectively a two-party system in the lower house (but with preferential voting), the opinion poll figures for the Greens agreed pretty well with the actual vote

It’s true that measurement error tends to bias towards 50%, and this matters in some surveys, but I would have guessed the US phantom third party support is the result of bias, not error. That is, I suspect people tend to overstate their support for third-party candidates in advance of the election, and that in the actual election they vote strategically for whichever of the major parties they dislike least.   My hypothesis would imply not much bias in countries where minor-party votes matter, and more bias in countries with first-past-the-post voting.  Unfortunately there’s also a pure measurement error hypothesis that’s consistent with the data, which is that people are just more careful about measuring minor-party votes in countries where they matter.

July 18, 2012

Global Innovation Barchart

So.  The 2012 Global Innovation Index is out and NZ looks quite good.  Our only Prime Minister has a graph on his Facebook page that looks basically like this.
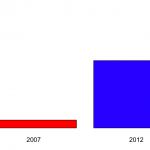
 

The graph shows that NZ was at rank 28 in 2007 and is now at rank 13.

A bar chart for two data points is a bit weird, though not nearly as bad as the Romney campaign’s efforts at Venn diagrams in the US.

The scaling is also a bit strange.  The y-axis runs from 1 to 30, but there’s nothing special about rank 30 on this index. If we run the y-axis all the way down to 141 (Sudan), we get the second graph on the right, which shows that New Zealand, compared to countries across the world, has always been doing pretty well.
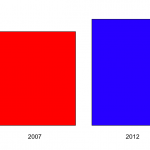
 

Now, there are some years missing on the plot, and the Global Innovation Index was reported for most of them.  Using the complete data, we get a graph like
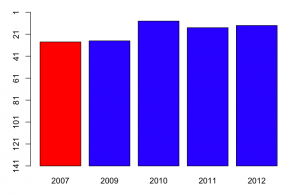
So, in fact, NZ was doing even better on this index in 2010, and we get some idea of the year-to-year fluctuations.   Now, a barchart is an inefficient way to display data with just one short time series like this: a table would be better.

More important, though, what is this index measuring.  Mr Key’s Facebook page doesn’t say. Some of the commenters do say, but incorrectly (for example, one says that it’s based on current government policies).  In fact, the  exact things that go into the index change every year.  For example, the 2012 index includes Wikipedia edits and Youtube uploads,  in early years internet access and telephone access were included.  There are also changes in definitions: in early years, values were measured in US$, now they are in purchasing-power parity adjusted dollars.

Some of the items (such as internet and telephone access) are definitely good, others (such as number of researchers and research expenditure) are good all things being equal, and for others (eg, cost of redundancy dismissal in weeks of pay, liberalised foreign investment laws) it’s definitely a matter of opinion.Some of the items are under the immediate control of the government (eg public education expenditure per pupil, tariffs), some can be influenced directly by government (eg, gross R&D funding, quality of trade and transport infrastructure), and some are really hard for governments to improve  in the short term (rule of law, GMAT mean test score, high-tech exports, Gini index).

Since the content and weighting varies each year, it’s hard to make good comparisons. On the plus side, the weighting clearly isn’t rigged to make National look good — the people who come up with the index couldn’t care less about New Zealand — but the same irrelevance will also tend to make the results for New Zealand more variable.   Some of the items in the index will have been affected by the global financial crisis and the Eurozone problems. New Zealand will look relatively better on these items, for reasons that are not primarily the responsibility of the current governments even in those countries, let alone here.

I’d hoped to track down why New Zealand had moved up in the rankings, to see if it was on indicators that the current administration could reasonably take credit for, but the variability in definitions makes it very hard to compare.
Repopulating Canterbury?

Stuff has a story about twins in Canterbury, which is driven by two general human tendencies shared even by statisticians: thinking babies are cute, and overestimating the strangeness of coincidences.  We hear that

Canterbury mums have given birth to 21 sets of twins in the past six weeks.

and

 10 years ago the average would have been about six to eight sets a month.

Using the StatsNZ Infoshare tool (go to Population | Births -VSB | Single and multiple confinements by DHB) we find about 100 sets of multiple births per year in Canterbury DHB and a further dozen or so in South Canterbury DHB, without much change for the past ten years.  That means about nine or so multiple births per month on average.  If you use the average twin rate for all of NZ  (2.7%) and the number of births in the Canterbury region, you get a slightly lower 7.7 sets of twins per month on average.

If there are, on average, 9 multiple births per month, how long would you have to wait for a six-week period with 21?  Because the possible six-week periods overlap, it’s hard to do this calculation analytically, but we can simulate it: 9 per month is 108 per year, which is 108/52 per week.  We simulate a long string of one-week counts from a Poisson distribution with mean 108/52, and see how long we have to  wait between six-week totals of at least 21.  The average waiting time is about two years.  (you have to be a bit careful: the proportion of six-week intervals over 21 is a lot more than one in two years, because of the overlap between six-week intervals)

So, this is a once in two years coincidence if we just look at Canterbury.  It’s much more likely if twin stories from other regions might also end up as news — the probability is hard to estimate, because twins in Canterbury really are more newsworthy than in, say, Waikato.

July 17, 2012

NRL Predictions, Round 20

Team Ratings for Round 20

Here are the team ratings prior to Round 20, along with the ratings at the start of the season. I have created a brief description of the method I use for predicting rugby games. Go to my Department home page to see this.

Current Rating Rating at Season Start Difference
Bulldogs 7.09 -1.86 9.00
Warriors 4.96 5.28 -0.30
Storm 4.22 4.63 -0.40
Broncos 3.91 5.57 -1.70
Rabbitohs 3.00 0.04 3.00
Sea Eagles 2.96 9.83 -6.90
Cowboys 2.90 -1.32 4.20
Wests Tigers 0.21 4.52 -4.30
Sharks -1.05 -7.97 6.90
Knights -1.92 0.77 -2.70
Dragons -2.08 4.36 -6.40
Titans -2.36 -11.80 9.40
Roosters -4.40 0.25 -4.70
Raiders -5.02 -8.40 3.40
Panthers -7.73 -3.40 -4.30
Eels -8.41 -4.23 -4.20


Performance So Far

So far there have been 136 matches played, 81 of which were correctly predicted, a success rate of 59.56%.

Here are the predictions for last week’s games.

Game Date Score Prediction Correct
1 Bulldogs vs. Eels Jul 13 32 – 12 20.00 TRUE
2 Broncos vs. Warriors Jul 13 10 – 8 3.73 TRUE
3 Knights vs. Sea Eagles Jul 14 32 – 6 -5.40 FALSE
4 Storm vs. Cowboys Jul 14 16 – 20 7.69 FALSE
5 Wests Tigers vs. Panthers Jul 14 26 – 18 13.29 TRUE
6 Raiders vs. Titans Jul 15 26 – 38 4.48 FALSE
7 Dragons vs. Sharks Jul 15 18 – 10 2.60 TRUE
8 Roosters vs. Rabbitohs Jul 16 22 – 24 -3.07 TRUE


Predictions for Round 20

Here are the predictions for Round 20

Game Date Winner Prediction
1 Sea Eagles vs. Bulldogs Jul 20 Sea Eagles 0.40
2 Titans vs. Broncos Jul 20 Broncos -1.80
3 Warriors vs. Knights Jul 21 Warriors 11.40
4 Eels vs. Storm Jul 21 Storm -8.10
5 Rabbitohs vs. Dragons Jul 21 Rabbitohs 9.60
6 Sharks vs. Raiders Jul 22 Sharks 8.50
7 Panthers vs. Roosters Jul 22 Panthers 1.20
8 Cowboys vs. Wests Tigers Jul 23 Cowboys 7.20


Super 15 Predictions, Week 22

Team Ratings for Week 22

Here are the team ratings prior to Week 22, along with the ratings at the start of the season. I have created a brief description of the method I use for predicting rugby games. Go to my Department home page to see this.

Current Rating Rating at Season Start Difference
Crusaders 9.02 10.46 -1.40
Sharks 4.77 0.87 3.90
Stormers 4.55 6.59 -2.00
Hurricanes 3.40 -1.90 5.30
Bulls 3.32 4.16 -0.80
Chiefs 3.09 -1.17 4.30
Reds 1.55 5.03 -3.50
Brumbies -0.89 -6.66 5.80
Blues -2.77 2.87 -5.60
Waratahs -3.13 4.98 -8.10
Highlanders -3.17 -5.69 2.50
Cheetahs -3.99 -1.46 -2.50
Lions -8.75 -10.82 2.10
Force -9.18 -4.95 -4.20
Rebels -11.11 -15.64 4.50


Performance So Far

So far there have been 120 matches played, 86 of which were correctly predicted, a success rate of 71.7%.

Here are the predictions for last week’s games.

Game Date Score Prediction Correct
1 Hurricanes vs. Chiefs Jul 13 28 – 25 5.20 TRUE
2 Brumbies vs. Blues Jul 14 16 – 30 10.30 FALSE
3 Crusaders vs. Force Jul 14 38 – 24 24.40 TRUE
4 Reds vs. Waratahs Jul 14 32 – 16 7.90 TRUE
5 Stormers vs. Rebels Jul 14 26 – 21 23.10 TRUE
6 Sharks vs. Cheetahs Jul 14 34 – 15 12.20 TRUE
7 Bulls vs. Lions Jul 14 37 – 20 16.50 TRUE


Predictions for Week 22

Here are the predictions for Week 22. The prediction is my estimated points difference with a positive margin being a win to the home team, and a negative margin a win to the away team.

Game Date Winner Prediction
1 Crusaders vs. Bulls Jul 21 Crusaders 10.20
2 Reds vs. Sharks Jul 21 Reds 1.30