Posts from February 2013 (44)

February 17, 2013

Census time

I just got my census form, so it must be about time to write about the NZ Census.  As I wrote when the West Island had theirs, it’s a good occasion to think about what the census is good for.  You might think that the success of surveys means that the census is no longer necessary, but as landline phones steadily become a less important part of people’s lives, the census (or some substitute) is actually increasingly vital to calibrate surveys.  In fact, part of my research is on the most effective ways of using this sort of information.

The primary problem with surveys is non-response — you can’t get hold of people, or you do catch them and they tell you to get far away and let them have dinner. Good survey organisations have ways to entice people into responding, but they also rely heavily on reweighting: if your survey under-represents families with young children, you can increase the weight given to those you did find, and reduce the bias.

This reweighting technique isn’t perfect, but it really does work.  The world’s largest telephone survey, the US Behavioral Risk Factor Surveillance System, used not to call cellphones.  It now does, providing an opportunity to compare the real cellphone results with the attempts to reweight.  Here are results from Michigan and Utah comparing a basic reweighting approach with a more sophisticated one, for landlines only and for landlines and cellphones. The improved reweighting approach (raking) made a big difference for the landline-only sample, moving it much closer to the landline+cellphone sample. So, reweighting really works.

Reweighting needs good data for the population, so every well-conducted survey from marketing research to opinion polls to the unemployment rate depends on the census, or some substitute.  In Scandinavian countries, the substitute is large administrative databases and record linkage.  We don’t have these, they’d be expensive to set up, and generally in English-speaking countries people don’t want them.  If you don’t have that sort of database, you need either a complete census or a mandatory survey of a random sample of people.

The United States uses both approaches: every ten years they have a complete census as required by the US Constitution, and in between they have the mandatory-response American Community Survey, which samples about 1% of the population each year.  In the US, the American Community Survey is both cheaper and more accurate than adding an extra census at five-year intervals.  In NZ it’s not clear — because of the smaller and more urban population, a sufficiently large survey might not be much less expensive than a five-yearly census.

What we want to avoid is the Canadian approach, where they decided to put nearly all the questions in a new, voluntary survey. The head of Statistics Canada resigned, and while he was forbidden by law to reveal the advice he had given to the government, he could say

I want to take this opportunity to comment on a technical statistical issue which has become the subject of media discussion. This relates to the question of whether a voluntary survey can become a substitute for a mandatory census.

It cannot.


[ps: the National Business Review has a story with quotes from me]

Briefly

  • Reconstructing the path of the Chelyabinsk meteorite in Google Earth
  • Researchers analysing internet commerce randomized trials (re)discover and solve a lot of problems in experimental design (via both Ben Goldacre and Andrew Gelman)
  • From Nature News: stem-cell research in Texas.  The company is outraged by “FDA’s decision to regulate your own stem cells as a drug”. That’s FDA requiring safe manufacturing — the company hasn’t even started clinical trials yet.
  • 80 patient groups sign up to the AllTrials campaign.
February 16, 2013

Visual perception illustration

This CT-scan picture illustrates an important perception issue for graphics.  Look carefully at the image, especially at the pattern of white spots.

_65896739_asd

Click through when you’re done
(more…)

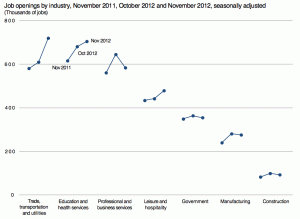
Redesigning a graph

There are lots of posts criticizing graphs out there on the internet, and a few that provide an improvement, but not many that show their working.

An post at The Why Axis redesigns the jobs chart put out each month by the US Bureau of Labor Statistics, which starts off like this:

ted_20130111

and goes through a number of intermediate versions including this

bls-in4


before the final design.

(thanks to Luis Apiolaza for pointing out The Why Axis on Twitter)

The dose matters

Q: Did you see that beer is healthy now?

A: Well, not exactly

Q: But there’s research and science and everything. Beer has fewer calories than wine.

A: Again, only up to a point.

Q: What? 43 isn’t less than 84 any more?

A: Beer has fewer calories per millilitre, so if you have 1/4 of a 425ml glass of beer, you get fewer calories  than in 100ml of wine.  In my experience, though, most people drink beer in larger units than 1/4 glass.  The calorie content per standard drink is very similar (slightly higher for beer, especially good beer).

Q: Wouldn’t you expect journalists to know a lot about how people usually drink alcohol?

A: That’s certainly the stereotype, but perhaps it’s out of date.

Q: But what about the micronutrients?

A: The press release mentions silicon.  That’s really a sign of desperation. There isn’t complete consensus that silicon even does anything vital in humans,  let alone that anyone is deficient in it.

Q: So where was this research published?

A: One of the websites of the British Beer and Pub Association

Q: So, not  exactly indepedent, peer-reviewed science?

A: Not as such, no.

February 15, 2013

Genuine sasquatch DNA probably not found

There’s been a bunch of publicity recently over claims that Bigfoot really exists and that a group of forensic scientists have the DNA to prove it.

After being rejected from the top journals either because of prejudice and hide-bound conservatism or because of not having any worthwhile evidence, the researchers have managed to publish some results in a peer-reviewed journal. That they set up for the purpose. (unkind scientists on Twitter are making jokes about the next issue, some of which are quite funny)

Ars Technica has the closest to actual information about the paper that I’ve seen, and their analysis sounds right to me. The paper says that the Bigfoot mitochondrial DNA matches humans, so the creature is a hybrid between humans and some unknown primate.  However, the mitochondrial DNA matches are mostly to sequences from Europe and the Middle East, not to Native American sequences, which looks like contamination rather than hybridisation.  Similarly, the results for nuclear DNA should show fairly long sequences matching humans, and other fairly long sequences that look similar to but not identical to other known primates, but they don’t seem to.

The genome data has only been released in PDF format, not in any of the formats that scientists normally use for storing genome sequences. When someone gets around to converting it, and the full surplus power of the world’s sequence matching software is turned loose, the results will be obvious — so the fact this hasn’t happened is not encouraging.

Is this scientific fraud?  Given the real attempts the researchers have made to publish their results, I think we can repeat an answer quoted by physicist Bob Park after the first cold fusion press conference: “Not yet.” And let’s hope it stays that way.

There oughtta be a law

David Farrar (among others) has written about a recent Coroner’s recommendation that high-visibility clothing should be compulsory for cyclists.  As he notes, ” if you are cycling at night you are a special sort of moron if you do not wear hi-vis gear”, but he rightly points out that isn’t the whole issue.

It’s easy to analyse a proposed law as if the only changes that result are those the law intends: everyone will cycle the same way, but they will all be wearing lurid chartreuse studded with flashing lights and will live happily ever after.  But safety laws, like other public-health interventions, need to be assessed on what will actually happen.

Bicycle helmet laws are a standard example.  There is overwhelming evidence that wearing a bicycle helmet reduces the risk of brain injury, but there’s also pretty good evidence that requiring bicycle helmets reduces cycling. Reducing the number of cyclists is bad from an individual-health point of view and also makes cycling less safe for those who remain. It’s not obvious how to optimise this tradeoff, but my guess based on no evidence is that pro-helmet propaganda might be better than helmet laws.

Another example was a proposal by some US airlines to require small children to have their own seat rather than flying in a parent’s lap. It’s clear that having their own seat is safer, but also much more expensive.  If any noticeable fraction of these families ended up driving rather than flying because of the extra cost, the extra deaths on the road would far outweigh those saved in the air.

It’s hard to predict the exact side-effects of a law, but that doesn’t mean they can be ignored any more than the exact side-effects of new medications can be ignored. The problem is that no-one will admit they don’t know the effects of a proposed law.  It took us decades to persuade physicians that they don’t magically know the effects of new treatments; let’s hope it doesn’t take much longer in the policy world.

[PS: yes, I do wear a helmet when cycling, except in the Netherlands, where bikes rule]

Overselling research findings

The Herald has a story claiming that facial proportions indicate racism (in men).  Well, they have a headline claiming that. The story (and the research paper, even more explicitly) pretty much contradicts the headline, and says that facial proportions have nothing to do with racism but indicate whether men write magazine articles about express their racist views or hide them.

If you believe the story, the relationship is very strong

Looking at the photos from the first study, a new group of participants evaluated men with wider, shorter faces as more prejudiced, and they were able to accurately estimate the target’s self-reported prejudicial beliefs just by looking at an image of his face.

and to be fair to the journalist, that’s what the researchers said.  If you look at their actual results, it’s not what they found.

They found an average difference of 1.92 on a 6-point perceived-racism scale for men who differ by 1 unit on the facial proportion scale.  The full range of the facial proportion scale appears to only be about 0.7 units. The paper doesn’t tell us the actual distribution of the measurements, but according to another research paper I found on the internets, the standard deviation of this facial proportion scale is about 0.12.  That means two randomly chosen men would differ by about 0.17 units, and the relationship  would predict a difference in the 6-point perceived-racism scale of about 0.3 units.  The association with self-reported racism was about as strong, though I haven’t been able to find enough information to compute the predicted differences (it shouldn’t be this hard).

In my book, that’s not an “accurate estimate”.


February 14, 2013

Super 15 Predictions, Round 1

Team Ratings for Round 1

Welcome to the new Super Rugby season. This year the predictions have been slightly changed with the help of a student, Joshua Dale. The home ground advantage now is different when both teams are from the same country to when the teams are from different countries. The basic method is described on my Department home page.

The introduction of a new team causes problems. I have arbitrarily assigned a rating of -10 to the Kings. This value worked reasonably well when the Rebels were introduced but obviously there will be uncertainty about games involving the Kings until they have some history.

Here are the team ratings prior to Round 1, along with the ratings at the start of the season.

Current Rating Rating at Season Start Difference
Crusaders 9.03 9.03 0.00
Chiefs 6.98 6.98 -0.00
Sharks 4.57 4.57 0.00
Hurricanes 4.40 4.40 0.00
Stormers 3.34 3.34 0.00
Bulls 2.55 2.55 0.00
Reds 0.46 0.46 -0.00
Brumbies -1.06 -1.06 -0.00
Blues -3.02 -3.02 0.00
Highlanders -3.41 -3.41 -0.00
Waratahs -4.10 -4.10 0.00
Cheetahs -4.16 -4.16 -0.00
Force -9.73 -9.73 0.00
Kings -10.00 -10.00 0.00
Rebels -10.64 -10.64 0.00


Predictions for Round 1

Here are the predictions for Round 1. The prediction is my estimated points difference with a positive margin being a win to the home team, and a negative margin a win to the away team.

Game Date Winner Prediction
1 Rebels vs. Force Feb 15 Rebels 1.60
2 Brumbies vs. Reds Feb 16 Brumbies 1.00


Petty drug users fill NZ homes?

Michelle Gosse points us to a discussion of minor drug crime on Stuff.  The headline “Petty drug users fill New Zealand jails” is definitely off, but most of the rest is just a bit messy.

The primary statistical issue is what epidemiologists call “incidence vs prevalence”, economists call “stocks vs flows”, and point-process mavens call “length-biased sampling”.   Because minor drug offenses lead to short sentences, offenders don’t stay in prison long, and so are a much smaller fraction of the prison population than they are of the court workload.  Specifically, as Michelle calculates, the figures mean there were at most an average of about 400 ‘petty drug users’ in NZ jails over the six years in question, from a prison population of more than 8000.  The ‘petty drug users’ are less than 5% of the prison population.  How much less than 5% is hard to calculate, because there’s a mixture of data on number of people and data on number of charges or offences, which aren’t just one to a customer.

The main point of the story is that lots of people are being prosecuted for minor drug crimes, and that this is dumb.  That, I can certainly agree with.  But one more statistical point is being missed. We get quotes like

The New Zealand Drug Foundation said the figures were alarming and showed the court-focused treatment of minor offenders was not working.

But Justice Minister Judith Collins said all drug offending – no matter how minor – should be dealt with through the criminal justice system.

Looking at the figures, about 3000 people a year are charged with cannabis possession. Based on drug-use survey data, about 385000 people use cannabis sometime during a year, so the criminal justice system is actually missing more than 99% of them.  Or, put another way, the proportion of petty drug users in jails (<5%) is substantially lower than in the NZ population as a whole (>14%).  In order to get convicted, you need to be guilty both of cannabis possession and of coming to the attention of the police.   You don’t need to be very cynical to worry about the impact of differential enforcement of the law.