May 6, 2013
Developing data visualisations: draft and redraft
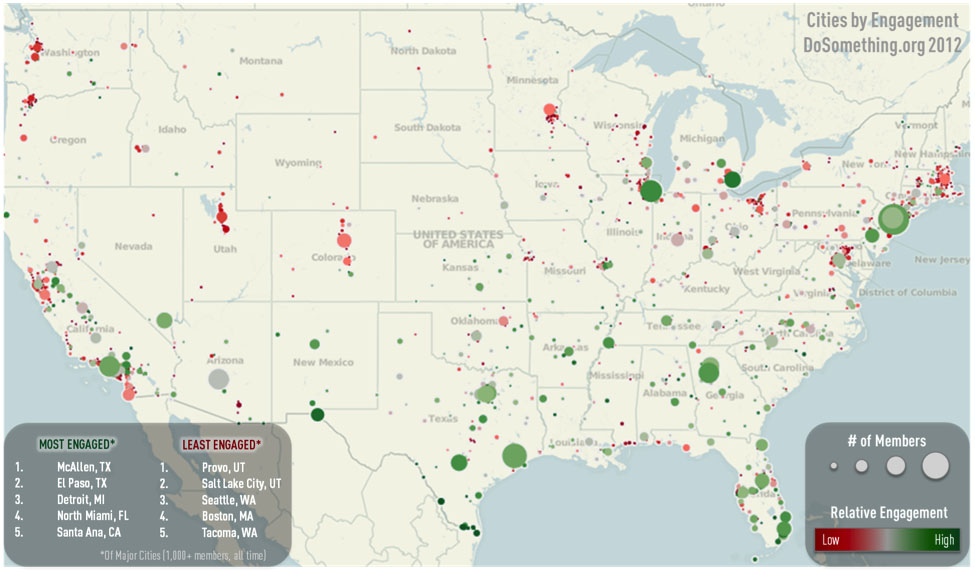
As I’ve commented before, it’s hard to find examples of the drafting and redrafting process for graphics, which is just as necessary as it is for text.
A post at Harvard Business Review describes the process, in the setting of a large non-profit organisation, with this as the result
Thomas Lumley (@tslumley) is Professor of Biostatistics at the University of Auckland. His research interests include semiparametric models, survey sampling, statistical computing, foundations of statistics, and whatever methodological problems his medical collaborators come up with. He also blogs at Biased and Inefficient See all posts by Thomas Lumley »