Posts from May 2013 (75)

May 27, 2013

Stat of the Week Competition: May 25 – 31 2013

Each week, we would like to invite readers of Stats Chat to submit nominations for our Stat of the Week competition and be in with the chance to win an iTunes voucher.

Here’s how it works:

  • Anyone may add a comment on this post to nominate their Stat of the Week candidate before midday Friday May 31 2013.
  • Statistics can be bad, exemplary or fascinating.
  • The statistic must be in the NZ media during the period of May 25 – 31 2013 inclusive.
  • Quote the statistic, when and where it was published and tell us why it should be our Stat of the Week.

Next Monday at midday we’ll announce the winner of this week’s Stat of the Week competition, and start a new one.

(more…)

Stat of the Week Competition Discussion: May 25 – 31 2013

If you’d like to comment on or debate any of this week’s Stat of the Week nominations, please do so below!

May 26, 2013

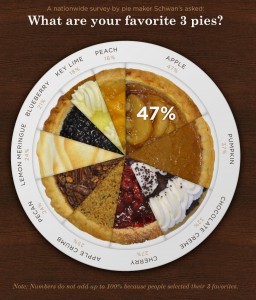
Late autumn piechart-of-the-week

It’s getting on for winter here, and last Thursday was the fourth Thursday in the month before the winter solstice — the season for Thanksgiving weekend.  To celebrate, a pie chart from DegreeSearch.org, whose blog usually contains advice for students, but occasionally branches out into feats of infographic creativity.

pie-chart

Animal testing: follow-up

Stuff has a headlineOverseas advice: ‘Don’t test party pills on animals’” and lead:

New Zealand will fly in the face of international animal welfare conventions if it allows legal highs to be tested on animals.

However, if you actually read the story, you find that this is not just misleading, but clearly untrue.

They mention responses from three countries. In Canada

… unable to find “any information suggesting” there was a ban on using animals in recreational drug or alcohol research testing in Canada.

In France and the EU

But France recently banned the use of animal testing in the cosmetic industry and policymakers are under pressure to extend that to the legal high, alcohol and tobacco industry.

The European Union has also introduced a ban on the sale of any cosmetic or personal care product which was tested on animals.

and only in the UK was the response consistent with the story

Judy MacArthur Clark, head of the animals in science regulation unit at UK’s Home Office, replied that any proposal to test for the safety of recreational drugs would be “rejected”.

You might also ask how these countries test legal highs for safety, if they don’t use animal testing.  The answer, of course, is that they don’t test legal highs for safety. Not one of these countries has legislation or procedures for approving and regulating new recreational psychoactive substances, but they all do require animal testing for new medications, two facts that Stuff might have considered mentioning.  The reference to LD50 lethal toxicity testing is especially misleading, since the same paper claimed credit in January for the fact that LD50 tests had been ruled out by the Minister.

The ‘legal highs’ regulations are new. No other country has anything similar.  New Zealand can’t base its testing regimes on what other countries are doing, because other countries aren’t doing it.  It would be useful to have some informed public discussion on how testing should be done, since it does involve the sort of tradeoffs where, in a democracy, the public should have input. This sort of story doesn’t help. Quite the reverse, in fact.


[Update: Here are three research papers involving animal (mouse and rat) testing of synthetic cannabis compounds done primarily for regulatory or forensic purposes, in Australia, the US, and Russia]
May 25, 2013

Error and margin of error

The British consumer magazine Which? ran a mystery-shopper investigation of UK pharmacies recently.  One of the topics they covered was homeopathic products, and in 13 of the 20 pharmacies where they asked about homeopathic remedies they got advice that violated the Royal Pharmaceutical Society guidelines for pharmacists.  An information sheet from the society says that pharmacists should

when asked, assist patients in making informed decisions about homoeopathic products by providing the necessary and relevant  information, particularly the lack of clinical evidence to support the efficacy of homoeopathic products. They must also ensure that patients do not stop taking their prescribed medication if they take a homoeopathic product. Importantly, pharmacists will be in a position to discuss healthcare options and be able to identify any more serious underlying medical conditions and, if required, refer the patient to another healthcare professional.

(the most current guidelines are not available to non-members, but similar advice is quoted by Which?).

One of the responses to these findings has been that the survey is too small to draw any conclusions, but as Ben Goldacre points out, if the sample is representative, a sample size of 20 is enough to be worried


With sample sizes this small, different ways of calculating the uncertainty give visibly different results (I get 41%-85% in R), but the practical implications are the same.  If we can trust the sampling, at least 40% of pharmacists are providing advice that’s contrary to their professional guidelines and, since the mystery-shopper scenario was a patient who’d had a persistent cough for a month, advice that could actually be dangerous.

It would be interesting to know what the situation is like in NZ, especially as homeopathic products are specifically exempted  from the new rules that will require evidence to support health claims.

Bar charts are boring: a redesign

At eagerpies, a redesign of a ‘boring bar chart’ according to graphic design principles, with steps including

  • “color exercises an undeniable psychological attraction… It captures and holds attention, multiplies the number of readers, assures better retention of the information and , in short, increases the scope of the message.”
  • We can add further perspicacity to the components of our pie by applying the Japanese concept of Ma. Ma represents space or a pause. It is, as Alan Fletcher describes, “the interval which gives shape to the whole”.
  • The ability to perceive motion was fundamental to our paleolithic survival as saber tooth tigers ate those of us who didn’t see them coming.  By adding motion to our graphic we can capitalize on the base human response to ensure attention is directed where it is most desired.

And if you think the result is going to be a 3D exploded pie chart, you aren’t cynical enough.

A landmark in the (specialised) field of quantitative data visualisation satire.

May 24, 2013

Fact checking is allowed

Stats New Zealand crime statistics:  criminal convictions in Asian, Middle Eastern, Latin American, African ethnicity are 4.4% of all convictions in the country as a whole, 13.7% in Auckland

Population: for NZ as a whole, 10% Asian in 2006 (projected to rise to 13% in 2016).  For Auckland, 24% in 2006.

So, people of Asian ethnicity are substantially less likely to be convicted of crimes (and, presumably, to commit crimes) than the population as a whole.  Would this be so hard to check when reporting? It can’t be much harder than getting responses from political leaders, which the Fairfax papers managed.

There’s more people than there used to be

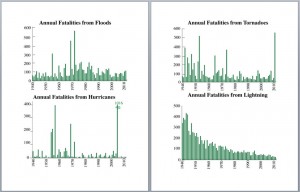
James Curran drew my attention to this graph, from daily-infographic (original source not given, but appears to be Reddit) showing weather-related deaths in the US

weatherdeaths

The decrease in lightning deaths is impressive, but it doesn’t look as though there is much decline in tornado deaths, and apparently an increase in flood deaths.  Why isn’t forecasting helping more? Business Insider Australia also found this graph and was confused

You can pick out some major weather events — Katrina, floods, different major fatal hurricanes — from the chart, but the most interesting one is definitely lightening deaths. 

While the other systems are generally sporadic, lightning fatalities have declines. 

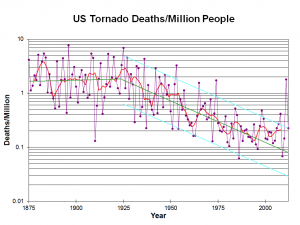
The explanation is simple: there are a lot more people now than in 1940 (about 2.5 times as many), so although the death rate has gone down, the number of deaths has stayed fairly stable. The National Severe Storms Lab (in Norman, Oklahoma, where they know from severe weather) gives this graph of death rates from tornados over more than a century

ustordeath2012


It would be even better to standardize by the population of the tornado-affected region, but that would be more difficult to define. It would also be better to remove some of the clutter from the graph: lose the grid lines and just have the points and a smooth curve. The message is still clear.

Deaths per million people were roughly steady until 1925, and have been decreasing since then, though the decrease may have levelled off.  The combination of sensible scaling by population, using a logarithmic scale, and adding a smoother and fitted line makes it easy to see the real trend in safety.  The first graph shows the danger of “letting the data speak for themselves”.


May 23, 2013

Communicating with journalists

Two useful pieces, worth reading even if you are neither a scientist nor a science journalist.

Ed Yong writes about what he is looking for when he asks scientists for comments on a research paper.

Note that a lot of this boils down to you telling me something interesting that I couldn’t have predicted. That’s why, when people ask me, “Do you have any specific questions?” the answer is often, “No.” What you have to tell me—what springs into your head—is probably going to be far more interesting that anything I’m expecting you to tell me. Hence, any questions I have will be really broad like, “What does this mean?” or “Do you buy it?” or “How does this fit with other stuff?” or “Science me up, nerd.”


Thomas Hayden describes how he reads scientific articles as a journalist

Just after the authors note “more research is needed,” you’ll usually find the one moment of speculation allowed in most papers. That’s where scientists get to suggest not just what their study contributes to the research enterprise, but what deeper implications it might have, or even how it might be applied. This is as close as the paper will come to answering the question, “So what? Why does any of this even matter?” [Note to science reporters: your job is to push the researchers to tell you more about this. Their job is to resist.]

May 22, 2013

NRL Predictions, Round 11

Team Ratings for Round 11

Here are the team ratings prior to Round 11, along with the ratings at the start of the season. I have created a brief description of the method I use for predicting rugby games. Go to my Department home page to see this.

Current Rating Rating at Season Start Difference
Rabbitohs 11.04 5.23 5.80
Roosters 7.48 -5.68 13.20
Sea Eagles 6.00 4.78 1.20
Storm 5.99 9.73 -3.70
Knights 3.97 0.44 3.50
Broncos 2.21 -1.55 3.80
Cowboys 2.20 7.05 -4.80
Sharks 0.22 -1.78 2.00
Bulldogs 0.11 7.33 -7.20
Panthers 0.08 -6.58 6.70
Raiders -0.03 2.03 -2.10
Dragons -1.70 -0.33 -1.40
Titans -5.18 -1.85 -3.30
Eels -10.75 -8.82 -1.90
Wests Tigers -12.42 -3.71 -8.70
Warriors -12.96 -10.01 -2.90


Performance So Far

So far there have been 80 matches played, 51 of which were correctly predicted, a success rate of 63.75%.

Here are the predictions for last week’s games.

Game Date Score Prediction Correct
1 Broncos vs. Titans May 17 32 – 6 8.36 TRUE
2 Rabbitohs vs. Wests Tigers May 17 54 – 10 23.94 TRUE
3 Dragons vs. Eels May 18 32 – 12 11.93 TRUE
4 Panthers vs. Warriors May 18 62 – 6 7.92 TRUE
5 Cowboys vs. Roosters May 18 8 – 12 0.03 FALSE
6 Sharks vs. Raiders May 19 30 – 20 3.43 TRUE
7 Knights vs. Bulldogs May 19 44 – 4 0.44 TRUE
8 Storm vs. Sea Eagles May 20 10 – 10 5.61 FALSE


Predictions for Round 11

Here are the predictions for Round 11. The prediction is my estimated expected points difference with a positive margin being a win to the home team, and a negative margin a win to the away team.

Game Date Winner Prediction
1 Wests Tigers vs. Cowboys May 24 Cowboys -10.10
2 Bulldogs vs. Broncos May 24 Bulldogs 2.40
3 Dragons vs. Panthers May 25 Dragons 2.70
4 Roosters vs. Storm May 25 Roosters 6.00
5 Sea Eagles vs. Raiders May 25 Sea Eagles 10.50
6 Warriors vs. Knights May 26 Knights -12.40
7 Eels vs. Titans May 26 Titans -1.10
8 Sharks vs. Rabbitohs May 27 Rabbitohs -6.30