Posts from October 2013 (67)

October 31, 2013

A statistic for the Day of the Dead

Remember the shootings at Sandy Hook elementary school in Newtown, Connecticut last December?

Since then, Slate magazine has been collecting news reports of gun deaths in the US. Here’s a map.

gundeaths


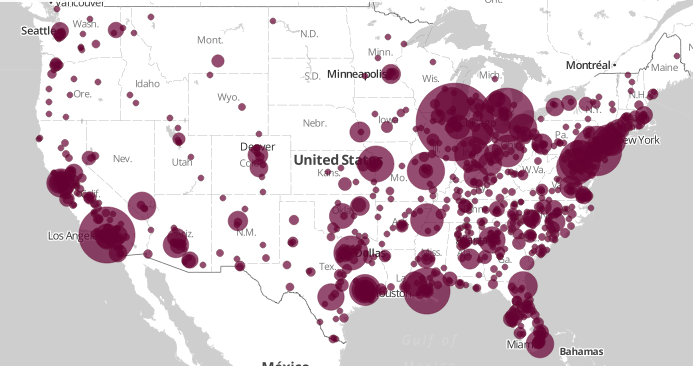
Actually, that’s a map of just the 1000 locations with the most deaths.

As of today, they have 10,001 deaths with the place and the name of victim known. That’s going to be an underestimate, since some don’t make the news. And since the number doesn’t include suicides, who make up about 60% of gun deaths in the US according to the CDC.  These mostly aren’t mass shootings, so they don’t attract international attention, but there are about as many gun deaths as car deaths in the US.

It’s not simply a matter of number of guns: the US has about 3.5 times the number of guns per capita as New Zealand, but about seven times the gun death rate per capita (nearly ten times the rate if you don’t include suicides).  It may be more that for a lot of people in the US, an important reason to own a gun is so that you would be able shoot another person with it if the circumstances arose. In a recent survey by Pew Research, 48% of gun owners gave self-protection as their main reason for owning a gun, and 79% said owning a gun made them feel safer. I can’t find figures for NZ, but I’d expect hunting and target shooting to be more common reasons here.

Scary lack of context

A number that should be in all stories about accidents on special days of the year: 4500.  That’s roughly how many new claims ACC gets per day: divide the 1.7 million per year by 365.

The Herald passes on the ACC’s figures of 31 Halloween-related injuries and 840 attributed to Guy Fawkes. First you have to divide by five, since these are aggregate totals over five years. Then divide by the average number of claims per day to find that Guy Fawkes Day is responsible for about 4% of a typical day’s injuries, and Halloween racks up about 0.1% of a day.

It wouldn’t be surprising if Halloween actually prevented more injuries than it causes — participating children will be doing something safe under adult supervision, rather than teasing innocent pets, fighting with siblings, getting underfoot in the kitchen, or participating in team sports.

October 30, 2013

Death or cake?

The Herald tells us

Most women are more scared of public speaking than they are of death, it has been revealed.

Researchers who polled 2,000 women found many are far more at ease with meeting their maker than they are of standing in a room talking to an audience hanging on their every word

On the other hand experience in  teaching suggests that a fairly large fraction of women would, given the choice, prefer public speaking to failing a university course.  

Since this is a survey commissioned by a London tourist attraction, and they aren’t providing any information about the survey methods, it’s hard to tell why the results are the way they are. All we can really tell is that it’s the sort of research where asking if the results are true is missing the point.

Briefly

  • The Legatum Prosperity Index ranks countries on a range of domains including economy, health, governance, social capital.  In their 2013 report NZ comes in 5th, and the top country in the Asia/Pacific.   Apparently, about a quarter of Kiwis believe there is widespread business or government corruption, and this is less than the figure almost everywhere else (Denmark is the exception)
  • A post on risk communication in the recent UK storm, from Ross Anderson, a computer security expert.
  • I have heard people comparing the UK storm to the recent Wellington storm, which didn’t cause any deaths despite stronger winds. Note that the UK storm killed roughly  one in twenty million of the UK population. In Wellington the same mortality rate would be about 0.01 people.
  • The Herald tells us Texting, reading magazines, eating and applying makeup are among the top 10 driver distractions, an AA Insurance survey has found.”  Looking at the press release, AA asked about twelve distractions. Eleven of them ended up in the top ten, so the list can’t be very sensitive to respondent opinion. 

Evils of axis

From NPR News, a story on the rise of electric bikes. With some unfortunate graphs.

bikeebike


Or, on the same axes

bikes

October 29, 2013

Pie chart of the week

whitepieFrom “Great Schools”, a US website with information about schools, via wtfviz.net

Significant bacon

Q: The Herald says  Bacon makes everything better – research“. What research is this?

A: Wired magazine and the Food Network did a simple analysis of recipe ratings, comparing recipes for roughly the same thing with and without bacon (and a similar analysis for some other ingredients). For example, they compared sandwiches with bacon to sandwiches without bacon.

Q: And did bacon make everything better, like the headline says?

A: No.

Q: Ok, did it make nearly everything better?

A: No.

Q: Lots of things?

A: Yes. Though not necessarily by very much. Here’s the results. The biggest improvement is about 0.2 points on a 5-point scale.

bacon


Q: Are there actual numbers given somewhere, or results of other comparisons of ingredients?

A: No.

Q: These eight groups look a bit strange: kale vs all pasta dishes, for example. Did they look at other groups?

A: They might well have, but they aren’t telling.

Q: Do they explain why bacon is so good?

A: The Herald has an explanation (in fact, they have it twice, so it must be good). It’s the Maillard reaction

Q: Is that something that’s unique about bacon, which would explain why it’s different from other ingredients.

A: No. It’s in a huge range of foods.

Q: Is this sort of thing the future of data journalism?

A: Well, Wired says “Food is so personal and subjective that we’re always talking about it in vague and imprecise ways. But one of the many amazing things you can do with big-ish data is give precise questions to answers that always seemed so subjective.

Q: Is that as bogus as it sounds?

A: Yes. For example, this is a sample where the average kale dish is rated  more highly than the average dessert. Generalisable and objective food preference ratings are not what we’re looking at.

Q: Does this story, perhaps, come from the Daily Mail?

A: Why, yes. Complete with the misspelling of sriracha.

October 28, 2013

Some long reads

Stat of the Week Competition: October 26 – November 1 2013

Each week, we would like to invite readers of Stats Chat to submit nominations for our Stat of the Week competition and be in with the chance to win an iTunes voucher.

Here’s how it works:

  • Anyone may add a comment on this post to nominate their Stat of the Week candidate before midday Friday November 1 2013.
  • Statistics can be bad, exemplary or fascinating.
  • The statistic must be in the NZ media during the period of October 26 – November 1 2013 inclusive.
  • Quote the statistic, when and where it was published and tell us why it should be our Stat of the Week.

Next Monday at midday we’ll announce the winner of this week’s Stat of the Week competition, and start a new one.

(more…)

Stat of the Week Competition Discussion: October 26 – November 1 2013

If you’d like to comment on or debate any of this week’s Stat of the Week nominations, please do so below!