Posts from October 2013 (67)

October 27, 2013

Fast-food outlets and obesity

Everyone knows that areas with more fast-food stores have more overweight people, and it certainly makes sense that fast food is bad for you. Like almost everything else, though, it gets more complicated when you start looking carefully.

Firstly, earlier this year Eric Crampton wrote in NBR about some research by an economics PhD student, Rachel Webb, who was trying to take advantage of this well-known relationship to unpick some aspects of correlation vs causation in the relationship between mother’s weight and infant’s birthweight. She found that, actually, areas in New Zealand with more fast-food outlets didn’t have more obesity to any useful and consistent extent.

Secondly, there’s new research on diet and fast food using data from the big NHANES surveys in the USA.  It confirms, as you might expect, that people who eat more fast food also eat less healthily at other times.


What you do know that ain’t so

In 2006, statistics celebrity Hans Rosling asked students at the Karolinska Insitute about international child mortality. In each of the following pairs of countries (presented in alphabetical order within pairs), which one has higher child mortality?

  • Sri Lanka or Turkey?
  • Poland or South Korea?
  • Malaysia or Russia?
  • Pakistan or Vietnam?
  • South Africa or Thailand

None of these are close — they differ by at least a factor of two — but the students did significantly worse than chance, averaging less than two correct answers out of five.

Gapminder.org has a new ‘Ignorance Project’ aiming to find out what important facts about global health and welfare are widely misunderstood.  They don’t just have a naive ‘information deficiency’ view of this ignorance:

When we encounter ignorance, we want to find a cure. Sometimes the facts just have to be delivered. But in many cases, the facts are little known as they don’t fit with other misunderstandings, they are counterintuitive, such as the most of the outdated concepts about the world population. In these cases we need to invent a new simple way to explain it. Those new explanations are the essence of Gapminder’s new free teaching material that make it fun and easy to teach and to learn a fact-based worldview.

It may not work, but it’s worth a try

(more…)

One in ten?

From Stuff, under the headline ‘One in 10 Kiwis now alcoholic

One in 10 New Zealanders could now be considered “alcoholic” according to new diagnostic criteria – but the majority of those with a drinking problem are unlikely to recognise it because the issue is so common.

The new estimate of 400,000 “alcoholics” in New Zealand – around 10 per cent of our 4.4 million population – was tallied up by Professor Doug Sellman from the National Addiction Centre at the University of Otago.

It is significantly higher than the Ministry of Health’s 2006 estimate which says 3 to 6 per cent of the population has an alcohol issue.

Sellman’s figures are based on the new diagnostic criteria for “alcohol use disorder” recently published in the fifth edition of the Diagnostic and Statistical Manual (DSM) of the American Psychiatric Association.

From the president of the American Society for Addiction Medicine, in a review of DSM-V

DSM-5 has “Alcohol Use Disorder,” which comes in mild, moderate and severe flavors, suggesting the inadequate pyramid approach. There are 11 possible symptoms of the “use disorder,” of which two are necessary to achieve a mild specifier, four for moderate and six for severe. “Alcohol use disorder is defined by a cluster of behavioral and physical symptoms,” the authors of DSM-5 state. I have no problem with that except that some may confuse “alcohol use disorder” with addictive disease or with alcoholism

Some may, indeed.

October 25, 2013

A third of young Americans have been arrested

Via Keith Humphreys, being arrested is a very common experience for young people in America: using the National Longitudinal Survey of Youth, Richard Braeme and colleagues found

By age 18, the in-sample cumulative arrest prevalence rate lies between 15.9% and 26.8%; at age 23, it lies between 25.3% and 41.4%. These bounds make no assumptions at all about missing cases. If we assume that the missing cases are at least as likely to have been arrested as the observed cases, the in-sample age-23 prevalence rate must lie between 30.2% and 41.4%. The greatest growth in the cumulative prevalence of arrest occurs during late adolescence and the period of early or emerging adulthood

Briefly

October 24, 2013

Burning issue

I’m in Sydney at the moment, so this is topical, as well as being an illustration of maps, infographics, and internet fact-checking.

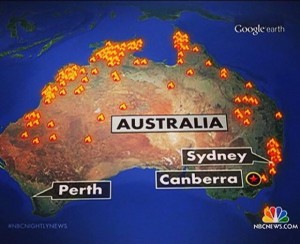
From Paul Rosenzweig on Twitter, allegedly a map of the bushfires shown on NBC News in the US

attributed to NBC News

People in Australia think this map is hilarious/outrageous depending on personality — the current emergency was just in New South Wales.  That was my reaction too. But the NBC News blog gets this right, which is a bit confusing

However, @Aus_ScienceWeek, the people who run National Science Week, point out that the map looks rather like the appropriate subsection of NASA’s satellite-based fire map from mid-September

firemap.2013251-2013260.2048x1024


so it might well be correct in the sense that there actually fires in those places, though still wrong as a description of the emergency.


October 23, 2013

ITM Cup Predictions for the ITM Cup Finals

Team Ratings for the ITM Cup Finals

Here are the team ratings prior to the ITM Cup Finals, along with the ratings at the start of the season. I have created a brief description of the method I use for predicting rugby games. Go to my Department home page to see this.

Here are the team ratings prior to this week’s games, along with the ratings at the start of the season.

Current Rating Rating at Season Start Difference
Canterbury 22.49 23.14 -0.70
Wellington 13.07 6.93 6.10
Auckland 7.57 9.02 -1.50
Tasman 5.25 -6.29 11.50
Counties Manukau 3.08 4.36 -1.30
Hawke’s Bay 0.85 -6.72 7.60
Waikato -0.32 5.25 -5.60
Otago -2.67 -4.44 1.80
Taranaki -3.53 3.92 -7.50
Bay of Plenty -5.56 -1.96 -3.60
Southland -8.61 -11.86 3.20
Northland -10.45 -8.26 -2.20
North Harbour -11.70 -7.43 -4.30
Manawatu -12.74 -8.97 -3.80


Performance So Far

There is a problem with the code I have been using for assessing performance, due to the unusual schedule in the ITM Cup, where some teams play more than one game in a week. I haven’t had time to alter the code so am omitting this section for the time being. Look at last week’s post to see how the predictions went. For the record, there were 3 games correct, out of 4 games played last week

Predictions for the ITM Cup Finals

Here are the predictions for the ITM Cup Finals. The prediction is my estimated expected points difference with a positive margin being a win to the home team, and a negative margin a win to the away team.

Game Date Winner Prediction
1 Tasman vs. Hawke’s Bay Oct 25 Tasman 8.90
2 Wellington vs. Canterbury Oct 26 Canterbury -4.90


Currie Cup Predictions for the Currie Cup Final

Team Ratings for the Currie Cup Final

Here are the team ratings prior to the Currie Cup Final, along with the ratings at the start of the season. I have created a brief description of the method I use for predicting rugby games. Go to my Department home page to see this.

Here are the team ratings prior to this week’s games, along with the ratings at the start of the season.

Current Rating Rating at Season Start Difference
Western Province 5.29 4.47 0.80
Sharks 4.03 3.24 0.80
Cheetahs 0.51 -2.74 3.30
Blue Bulls -0.35 0.59 -0.90
Lions -0.67 -1.22 0.50
Griquas -10.97 -6.48 -4.50


Performance So Far

So far there have been 32 matches played, 17 of which were correctly predicted, a success rate of 53.1%.

Here are the predictions for last week’s games.

Game Date Score Prediction Correct
1 Western Province vs. Lions Oct 19 33 – 16 12.70 TRUE
2 Sharks vs. Cheetahs Oct 19 33 – 22 11.00 TRUE


Predictions for the Currie Cup Final

Here are the predictions for the Currie Cup Final. The prediction is my estimated expected points difference with a positive margin being a win to the home team, and a negative margin a win to the away team.

Game Date Winner Prediction
1 Western Province vs. Sharks Oct 26 Western Province 8.80


October 22, 2013

Historical infographics

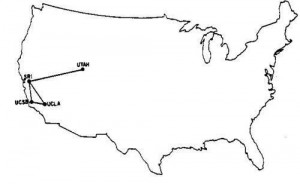
A detailed map of the entire internet, the year I was born

BXIPZhIIAAIG0gM


And now

(via Michael MacAskill)

Surprises in data

What’s wrong with this sentence? (source)

The people we meet on the other star system are humans who were collected from Earth a hundred thousand years ago, and hence are virtually identical with us.

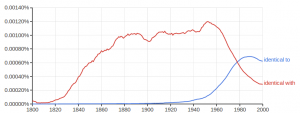
Many people would correct ‘identical with us’ to ‘identical to us’. Some people would argue that ‘identical with’ is not merely unconventional, but wrong for good reasons.

From Language Log, this is an example of linguistic change in process

identicalto_with


Until relatively recently, “identical with” was overwhelmingly the standard way to write. Now it isn’t. That’s not surprising. What’s surprising is that we mostly don’t notice the change, and often don’t notice how arbitrary these standards are.