Desolation of Smog
From the air pollution monitor at the US Embassy in Beijing
01-16-2014 04:00; PM2.5; 671.0; 613;
  Beyond Index (at 24-hour exposure at this level)
“Beyond Index” means “when we made up the categories, we didn’t bother to go this high because it obviously wouldn’t be needed.” 671 μg/m3 of PM2.5 is roughly the same as the peak particulate air pollution in the Great London Smog of 1952 — only a rough comparison is possible because air pollution was measured differently back then. The pollution isn’t quite as bad as the London Smog because the Beijing air improves around midday and again in the evening. The 24 hour average was ‘only’ 448μg/m3, and the following day’s average was down to 154, a bit more than four times the US standard for the 98th percentile of days.
For comparison, here’s a New Zealand graph from GNS. The y-axis is PM10, which includes larger particles that aren’t measured in the Beijing figure; PM2.5 would be very roughly half as high.

Last month there was a story at Quartz about China’s air pollution, mentioning how sharing face-mask pictures had become a thing. Here are some examples, from the South China Morning Post
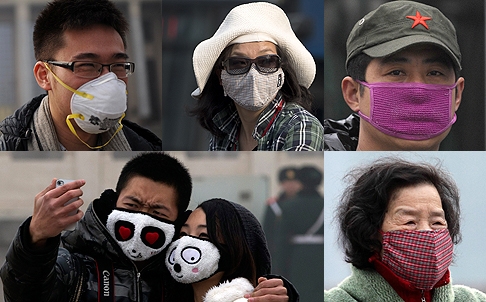
They make good photos. They don’t protect you from PM2.5, which goes straight through ordinary paper or cloth masks.
Thomas Lumley (@tslumley) is Professor of Biostatistics at the University of Auckland. His research interests include semiparametric models, survey sampling, statistical computing, foundations of statistics, and whatever methodological problems his medical collaborators come up with. He also blogs at Biased and Inefficient See all posts by Thomas Lumley »