Graphics design rules
1. Barcharts must start at zero, from Storytelling with Data
2. Infographics as a proxy for overall news quality (barcharts must start at zero), from The Functional Art
3. And, from Storytelling with Data, perhaps the worst use of colour ever in donut charts. Statisticians keep saying it’s hard to compare pie/donut charts reliably. Notice how the two donuts below look very similar? Now try looking at the legends
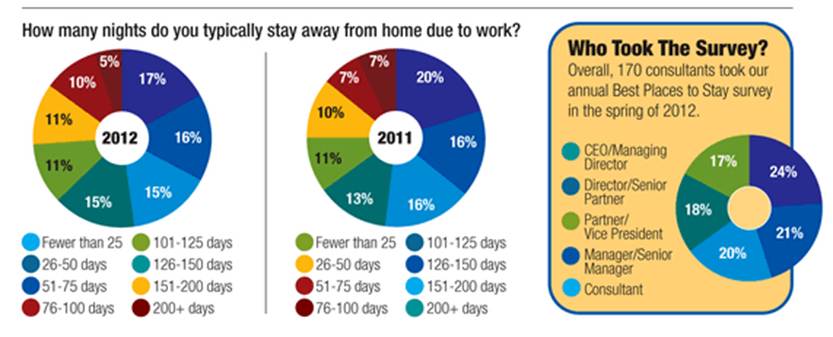
Remember: U and DON’T makes DONUT.
Thomas Lumley (@tslumley) is Professor of Biostatistics at the University of Auckland. His research interests include semiparametric models, survey sampling, statistical computing, foundations of statistics, and whatever methodological problems his medical collaborators come up with. He also blogs at Biased and Inefficient See all posts by Thomas Lumley »