Posts from July 2015 (36)

July 25, 2015

Some evidence-based medicine stories

  • Ben Goldacre has a piece at Buzzfeed, which is nonetheless pretty calm and reasonable, talking about the need for data transparency in clinical trials
  • The Alltrials campaign, which is trying to get regulatory reform to ensure all clinical trials are published, was joined this week by a group of pharmaceutical company investors.  This is only surprising until you think carefully: it’s like reinsurance companies and their interest in global warming — they’d rather the problems would go away, but there’s not profit in just ignoring them.
  • The big potential success story of scanning the genome blindly is a gene called PCSK9: people with a broken version have low cholesterol. Drugs that disable PCSK9 lower cholesterol a lot, but have not (yet) been shown to prevent or postpone heart disease. They’re also roughly 100 times more expensive than the current drugs, and have to be injected. None the less, they will probably go on sale soon.
    A survey of a convenience sample of US cardiologists found that they were hoping to use the drugs in 40% of their patients who have already had a heart attack, and 25% of those who have not yet had one.
July 24, 2015

Are beneficiaries increasingly failing drug test?

Stuff’s headline is “Beneficiaries increasingly failing drug tests, numbers show”.

The numbers are rates per week of people failing or refusing drug tests. The number was 1.8/week for the first 12 weeks of the policy and 2.6/week for the whole year 2014, and, yes, 2.6 is bigger than 1.8.  However, we don’t know how many tests were performed or demanded, so we don’t know how much of this might be an increase in testing.

In addition, if we don’t worry about the rate of testing and take the numbers at face value, the difference is well within what you’d expect from random variation, so while the numbers are higher it would be unwise to draw any policy conclusions from the difference.

On the other hand, the absolute numbers of failures are very low when compared to the estimates in the Treasury’s Regulatory Impact Statement.

MSD and MoH have estimated that once this policy is fully implemented, it may result in:

• 2,900 – 5,800 beneficiaries being sanctioned for a first failure over a 12 month period

• 1,000 – 1,900 beneficiaries being sanctioned for a second failure over a 12 month period

• 500 – 1,100 beneficiaries being sanctioned for a third failure over a 12 month period.

The numbers quoted by Stuff are 60 sanctions in total over eighteen months, and 134 test failures over twelve months.  The Minister is quoted as saying the low numbers show the program is working, but as she could have said the same thing about numbers that looked like the predictions, or numbers that were higher than the predictions, it’s also possible that being off by an order of magnitude or two is a sign of a problem.


July 23, 2015

Diversity is (very slightly) good for you

This isn’t in the local news, but there are stories about it in the world media: a new paper in Nature on associations between genetic diversity and various desirable characteristics.  I’m one of the authors — and so is pretty much everyone else, since this research combines analyses from over 100 cohort studies.  The Nature paper is actually the second publication in this area that I’ve worked on.  My first Auckland MSc student in Statistics, Anish Scaria, did some analysis for a different definition of genetic diversity, and that plus data from a smaller group of cohort studies was published last year.

What did we do? Humans, like most animals and many plants1, have two copies of our complete genome2. We looked at how similar these two copies were, essentially measuring small amounts of inbreeding from distant ancestors.

Each cohort study had measured a large number of binary genetic variants, ranging from 300,000 to 1,000,000. In the first paper we looked at just the proportion of variants where the two copies were the same3. In the new paper we looked at contiguous chunks of genome where all the variants were the same in the two copies, which gives a more sensitive indication of the chunks of genome being inherited from the same distant ancestor. We compared people based on the proportion of genome that was in these contiguous chunks.

The comparisons were done separately within each cohort and the associations were then averaged: obviously you would get different genetic diversity in a cohort from Iceland versus a cohort of African-Americans, and we need to make sure that sort of difference didn’t get incorporated in the analysis. Similarly, for cohorts that recruited people of different ancestries, the comparisons were done between people of the same basic ancestry and averaged.

Our first paper found that people with more difference between their two genomic copies lived (very slightly) longer on average; the new paper found that (to a very small extent) they were taller, had higher average scores on IQ tests, and had lower cholesterol. The basic direction of the results wasn’t surprising, but the lack of association for specific diseases and risk factors was — there was no sign of a difference in diabetes, for example.

Scientifically, the data provide a little bit of extra support for height and whatever IQ tests measure having been under evolutionary selection, and a bit of negative evidence on diabetes and heart disease having been under evolutionary selection in human history. And also a bit of support for the idea that you can actually get more than a hundred groups of independent and fiercely territorial academics to work together sometimes.


1. Some important crop plants, such as wheat, cabbage, and sugarcane, are insanely more complicated
2. Yes, I’m ignoring the sex chromosomes here.
3. “Homozygous” is the technical term.

July 22, 2015

Are reusable shopping bags deadly?

There’s a research report by two economists arguing that San Francisco’s bag on plastic shopping bags has led to a nearly 50% increase in deaths from foodborne disease, an increase of about 5.5 deaths per year.  I was asked my opinion on Twitter. I don’t believe it.

What the analysis does show is some evidence that emergency room visits for foodborne disease have increased: the researchers analysed admissions for E. coli, Salmonella, and Campylobacter infection, and found an increase in San Francisco but not in neighbouring counties. There’s a statistical issue in that the number of counties is small and the standard error estimates tend to be a bit unreliable in that setting, but that’s not prohibitive. There’s also a statistical issue in that we don’t know which (if any) infections were related to contamination of raw food, but again that’s not prohibitive.

The problem with the analysis of deaths is the definition: the deaths in the analysis were actually all of the ICD10 codes A00-A09. Most of this isn’t foodborne bacterial disease, and a lot of the deaths from foodborne bacterial disease will be in settings where shopping bags are irrelevant. In particular, two important contributors are

  • Clostridium difficile infections after antibiotic use, which has a fairly high mortality rate
  • Diarrhoea in very frail elderly people, in residential aged care or nursing homes.

In the first case, this has nothing to do with food. In the second case, it’s often person-to-person transmission (with norovirus a leading cause), but even if it is from food, the food isn’t carried in reusable shopping bags.

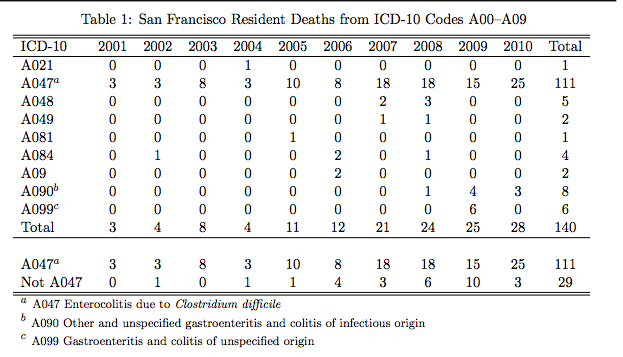
Tomás Aragón with the San Francisco department of Public Health, has a more detailed breakdown of the death data than were available to the researchers. His memo I think is too negative on the statistical issues, but the data underlying the A00-A09 categories are pretty convincing:

aragon

Category A021 is Salmonella (other than typhoid); A048 and A049 are other miscellaneous bacterial infections; A081 and A084 are viral. A090 and A099 are left-over categories that are supposed to exclude foodborne disease but will capture some cases where the mechanism of infection wasn’t known.  A047 is Clostridium difficile.   The apparent signal is in the wrong place. It’s not obvious why the statistical analysis thinks it has found evidence of an effect of the plastic-bag ban, but it is obvious that it hasn’t.

Here, for comparison, are New Zealand mortality data for specific foodborne infections, from foodsafety.govt.nz, the most recent year available

nz

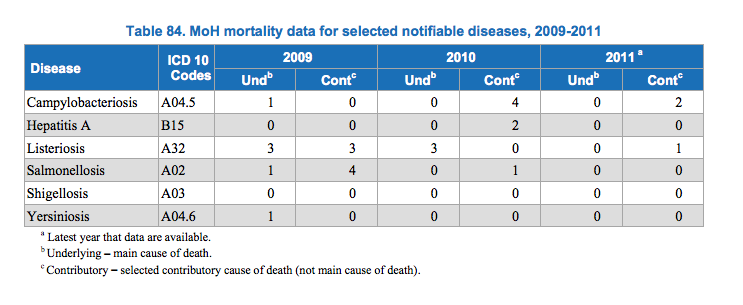
Over the three years, there were only ten deaths where the underlying cause was one of these food-borne illnesses — a lot of people get sick, but very few die.


The mortality data don’t invalidate the analysis of hospital admissions, where there’s a lot more information and it is actually about (potentially) foodborne diseases.  More data from other cities — especially ones that are less atypical than San Francisco — would be helpful here, and it’s possible that this is a real effect of reusing bags. The economic analysis,however, relies heavily on the social costs of deaths.

NRL Predictions for Round 20

Team Ratings for Round 20

The basic method is described on my Department home page.

Here are the team ratings prior to this week’s games, along with the ratings at the start of the season.

Current Rating Rating at Season Start Difference
Roosters 10.23 9.09 1.10
Broncos 8.36 4.03 4.30
Cowboys 6.22 9.52 -3.30
Storm 4.44 4.36 0.10
Rabbitohs 4.09 13.06 -9.00
Bulldogs 1.78 0.21 1.60
Warriors 1.61 3.07 -1.50
Dragons -1.12 -1.74 0.60
Sea Eagles -1.34 2.68 -4.00
Raiders -2.02 -7.09 5.10
Sharks -2.60 -10.76 8.20
Panthers -2.91 3.69 -6.60
Eels -3.82 -7.19 3.40
Knights -4.03 -0.28 -3.80
Wests Tigers -8.09 -13.13 5.00
Titans -9.46 -8.20 -1.30


Performance So Far

So far there have been 136 matches played, 79 of which were correctly predicted, a success rate of 58.1%.

Here are the predictions for last week’s games.

Game Date Score Prediction Correct
1 Storm vs. Panthers Jul 17 52 – 10 5.50 TRUE
2 Eels vs. Bulldogs Jul 17 4 – 28 0.80 FALSE
3 Dragons vs. Rabbitohs Jul 18 8 – 24 0.00 FALSE
4 Knights vs. Titans Jul 18 30 – 2 5.30 TRUE
5 Raiders vs. Sharks Jul 18 20 – 21 4.40 FALSE
6 Roosters vs. Warriors Jul 19 24 – 0 10.80 TRUE
7 Broncos vs. Wests Tigers Jul 19 42 – 16 18.40 TRUE
8 Sea Eagles vs. Cowboys Jul 20 12 – 30 -2.40 TRUE


Predictions for Round 20

Here are the predictions for Round 20. The prediction is my estimated expected points difference with a positive margin being a win to the home team, and a negative margin a win to the away team.

Game Date Winner Prediction
1 Broncos vs. Titans Jul 24 Broncos 20.80
2 Wests Tigers vs. Roosters Jul 24 Roosters -15.30
3 Rabbitohs vs. Knights Jul 25 Rabbitohs 11.10
4 Storm vs. Dragons Jul 25 Storm 8.60
5 Warriors vs. Sea Eagles Jul 25 Warriors 7.00
6 Bulldogs vs. Sharks Jul 26 Bulldogs 7.40
7 Panthers vs. Raiders Jul 26 Panthers 2.10
8 Cowboys vs. Eels Jul 27 Cowboys 13.00


July 20, 2015

Pie chart of the day

From the Herald (squashed-trees version, via @economissive)

CKUXF6iUsAAWPr-

For comparison, a pie of those aged 65+ in NZ regardless of where they live, based on national population estimates:

CKUbriWVAAAWbpT

Almost all the information in the pie is about population size; almost none is about where people live.

A pie chart isn’t a wonderful way to display any data, but it’s especially bad as a way to show relationships between variables. In this case, if you divide by the size of the population group, you find that the proportion in private dwellings is almost identical for 65-74 and 75-84, but about 20% lower for 85+.  That’s the real story in the data.

Stat of the Week Competition: July 18 – 24 2015

Each week, we would like to invite readers of Stats Chat to submit nominations for our Stat of the Week competition and be in with the chance to win an iTunes voucher.

Here’s how it works:

  • Anyone may add a comment on this post to nominate their Stat of the Week candidate before midday Friday July 24 2015.
  • Statistics can be bad, exemplary or fascinating.
  • The statistic must be in the NZ media during the period of July 18 – 24 2015 inclusive.
  • Quote the statistic, when and where it was published and tell us why it should be our Stat of the Week.

Next Monday at midday we’ll announce the winner of this week’s Stat of the Week competition, and start a new one.

(more…)

Stat of the Week Competition Discussion: July 18 – 24 2015

If you’d like to comment on or debate any of this week’s Stat of the Week nominations, please do so below!

July 19, 2015

Briefly

  • In the interests of balance, a post at Public Address by Rob Salmond, who did the analysis in the ‘Chinese names’ real-estate leak.  And a robust twitter discussion with him, Keith Ng, and Tze Ming Mok.
  • Stats New Zealand has a new standard question about gender identity (as distinguished from sex), acknowledging that it isn’t as simple as some people would like it to be.
  • The most important aspects of health seem to vary by age: “older raters gave significantly more weight to functional limitations and social functioning and less to morbidities and pain experience, compared to younger raters.” (via @hildabast)
  • Priceonomics has a post on the most common and most distinctive ingredients in recipes from around the world. The list illustrates the problem with the ‘distinctiveness’ metric (as Kieran Healy pointed out: whiskey is really not the distinctive signature of Irish food).  It also shows up other problems: for example, “African” and “Asian” are both listed as cuisines. Fundamentally, the limitation in is the recipe lists and the approximations made: galangal shows up as a reasonable candidate for most-distinctive Thai ingredient partly because there aren’t any substitutes; cayenne is the most widely used ingredient in the Mexican recipes because it’s being substituted for other chillis.
July 16, 2015

Don’t just sit there, do something

The Herald’s story on sitting and cancer is actually not as good as the Daily Mail story it’s edited from. Neither one gives the journal or researchers (the paper is here). Both mention a previous study, but the Mail goes into more useful detail.

The basic finding is

Longer leisure-time spent sitting, after adjustment for physical activity, BMI and other factors, was associated with risk of total cancer in women (RR=1.10, 95% CI 1.04-1.17 for >6 hours vs. <3 hours per day), but not men (RR=1.00, 95% CI 0.96-1.05)

The lack of association in men was a surprise, and strongly suggests that the result for women shouldn’t be believed. It’s also notable that while the estimated associations with a few types of cancer look strong, the lower limits on the confidence intervals don’t look strong:

risk of multiple myeloma (RR=1.65, 95% CI 1.07-2.54), invasive breast cancer (RR=1.10, 95% CI 1.00-1.21), and ovarian cancer (RR=1.43, 95% CI 1.10-1.87).

Since the researchers looked at eighteen subsets of cancer in addition to all types combined, and these are the top three, the real lower limits are even lower.

The stories referred to previous research, published last year, which summarised many previous studies of sitting and cancer risk.  That’s good, but the summary wasn’t entirely accurate. From the Herald:

Previous research by the University of Regensburg in Germany found that spending too much time sitting raised the risk of bowel and lung cancer in both men and women.

In fact, the previous research didn’t look separately at men and women (or, at least, didn’t report doing so). While you would expect similar results in men and women, that study doesn’t address the question.

The Mail does have one apparently good contextual point

However, this previous study – which reviewed 43 other studies – did not find a link between sitting and a higher risk of breast and ovarian cancer. 

But when you look at the actual figures, there’s no real inconsistency between the two studies: they both report weak evidence of higher risk; it’s just a question of whether the lower end of the confidence interval happens to cross the ‘no difference’ line for a particular subset of cancers.

Overall, this is a pretty small risk difference to detect from observational data. If you didn’t already think that long periods of sitting could be bad for you, this wouldn’t be a reason to start.