Posts from August 2015 (48)

August 19, 2015

NRL Predictions for Round 24

Team Ratings for Round 24

The basic method is described on my Department home page.

Here are the team ratings prior to this week’s games, along with the ratings at the start of the season.

Current Rating Rating at Season Start Difference
Roosters 10.08 9.09 1.00
Broncos 7.44 4.03 3.40
Rabbitohs 5.66 13.06 -7.40
Storm 5.48 4.36 1.10
Cowboys 5.34 9.52 -4.20
Sea Eagles 3.34 2.68 0.70
Bulldogs 2.58 0.21 2.40
Dragons 0.57 -1.74 2.30
Raiders -0.71 -7.09 6.40
Sharks -1.84 -10.76 8.90
Panthers -2.87 3.69 -6.60
Warriors -4.28 3.07 -7.40
Eels -5.42 -7.19 1.80
Knights -6.71 -0.28 -6.40
Wests Tigers -6.79 -13.13 6.30
Titans -10.53 -8.20 -2.30


Performance So Far

So far there have been 168 matches played, 96 of which were correctly predicted, a success rate of 57.1%.

Here are the predictions for last week’s games.

Game Date Score Prediction Correct
1 Cowboys vs. Rabbitohs Aug 13 18 – 31 5.20 FALSE
2 Broncos vs. Dragons Aug 14 32 – 6 7.30 TRUE
3 Wests Tigers vs. Knights Aug 15 18 – 24 4.40 FALSE
4 Panthers vs. Warriors Aug 15 24 – 10 4.00 TRUE
5 Roosters vs. Eels Aug 15 28 – 18 19.90 TRUE
6 Raiders vs. Sea Eagles Aug 16 36 – 26 -2.90 FALSE
7 Bulldogs vs. Titans Aug 16 36 – 14 15.10 TRUE
8 Sharks vs. Storm Aug 17 2 – 30 -0.60 TRUE


Predictions for Round 24

Here are the predictions for Round 24. The prediction is my estimated expected points difference with a positive margin being a win to the home team, and a negative margin a win to the away team.

Game Date Winner Prediction
1 Dragons vs. Panthers Aug 20 Dragons 6.40
2 Rabbitohs vs. Bulldogs Aug 21 Rabbitohs 6.10
3 Sharks vs. Wests Tigers Aug 22 Sharks 7.90
4 Warriors vs. Cowboys Aug 22 Cowboys -5.60
5 Roosters vs. Broncos Aug 22 Roosters 5.60
6 Titans vs. Raiders Aug 23 Raiders -6.80
7 Sea Eagles vs. Eels Aug 23 Sea Eagles 11.80
8 Storm vs. Knights Aug 24 Storm 15.20


Currie Cup Predictions for Round 3

Team Ratings for Round 3

The basic method is described on my Department home page.

Here are the team ratings prior to this week’s games, along with the ratings at the start of the season.

Current Rating Rating at Season Start Difference
Western Province 5.04 4.93 0.10
Lions 3.84 3.04 0.80
Sharks 2.79 3.43 -0.60
Blue Bulls 1.27 0.17 1.10
Cheetahs -2.27 -1.75 -0.50
Pumas -6.27 -6.47 0.20
Griquas -8.49 -7.81 -0.70
Kings -9.80 -9.44 -0.40


Performance So Far

So far there have been 8 matches played, 6 of which were correctly predicted, a success rate of 75%.

Here are the predictions for last week’s games.

Game Date Score Prediction Correct
1 Lions vs. Pumas Aug 14 44 – 27 13.20 TRUE
2 Blue Bulls vs. Griquas Aug 14 36 – 12 12.60 TRUE
3 Western Province vs. Cheetahs Aug 15 9 – 3 11.30 TRUE
4 Sharks vs. Kings Aug 15 33 – 25 16.60 TRUE


Predictions for Round 3

Here are the predictions for Round 3. The prediction is my estimated expected points difference with a positive margin being a win to the home team, and a negative margin a win to the away team.

Game Date Winner Prediction
1 Kings vs. Pumas Aug 21 Pumas -0.00
2 Griquas vs. Cheetahs Aug 21 Cheetahs -2.70
3 Sharks vs. Lions Aug 22 Sharks 2.40
4 Blue Bulls vs. Western Province Aug 22 Western Province -0.30


World Statistics Day – October 20, 2015

What are you doing on October 20? Statisticians all over the world will be showcasing the value of their work under the theme ‘Better data, better lives’. Quite. Here is the logo for this year, downloadable from the UNStats site here.

WSD_Logo_Final_Languages_Outline


The World Statistics Day was proclaimed by the United Nations General Assembly in 2010 – so, fairly recently – to recognise the importance of statistics in shaping our societies. National and regional statistical days already existed in more than 100 countries, but the General Assembly’s adoption of this international day as 20 October brought extra momentum. That first World Statistics Day in October 2010 was marked in more than 130 countries and areas.

According to UNStats, this year marks an important cornerstone for official statistics, with the conclusion of the Millennium Development Goals (see how countries have fared here), the post-2015 development agenda, the data revolution (see what the Data Revolution Group set up by UN Secretary-General Ban Ki-Moon has to say here), the preparations for the 2020 World Population and Housing Census Programme and the likes.

Statschat hasn’t heard a lot about what might be happening in New Zealand and elsewhere – it might yet be a bit too early for announcements – but if you are running an event or know of one, please let us know. In the meantime, one cute initiative of UNStats is to translate the English logo into many of the languages of the world. We couldn’t miss the opportunity to have UNStats do ours in the first language of this country, te reo Māori. Te tino kē hoki o te moko nā! (Nice logo!)


WorldStatsDay_Logo_Maori-01

August 17, 2015

How would you even study that?

From XKCD

every_seven_seconds

“How would you even study that?” is an excellent question to ask when you see a surprising statistic in the media. Often the answer is “they didn’t,” but sometimes you get to find out about some really clever research technique.

More diversity pie-charts

These ones are from the Seattle Times, since that’s where I was last week.

IMAG0103

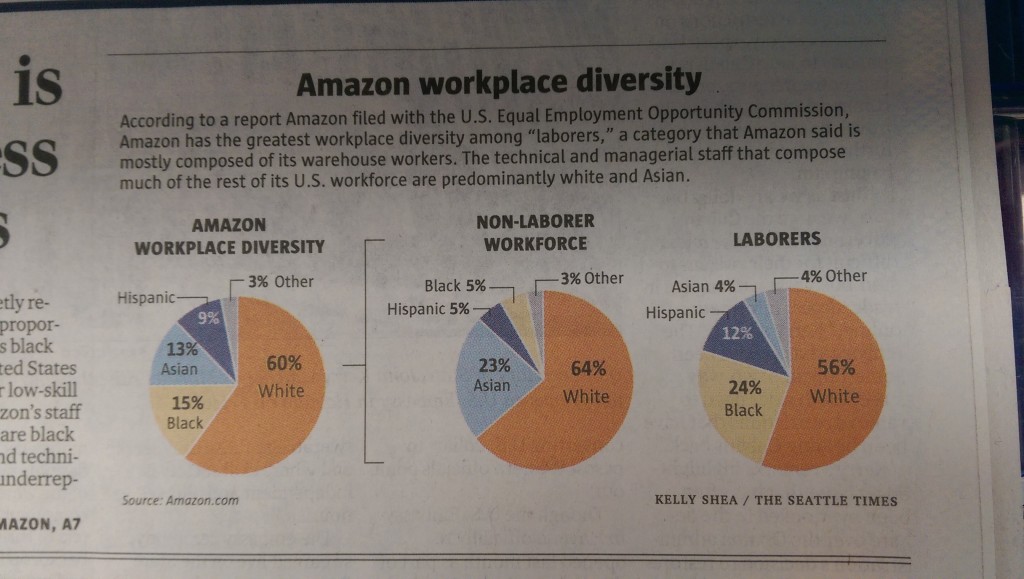
Amazon.com, like many other tech companies, had been persuaded to release figures on gender and ethnicity for its employees. On the original figures, Amazon looked  different from the other companies, but Amazon is unusual in being a shipping-things-around company as well as a tech company. Recently, they released separate figures for the ‘labourers and helpers’ vs the technical and managerial staff.  The pie chart shows how the breakdown makes a difference.

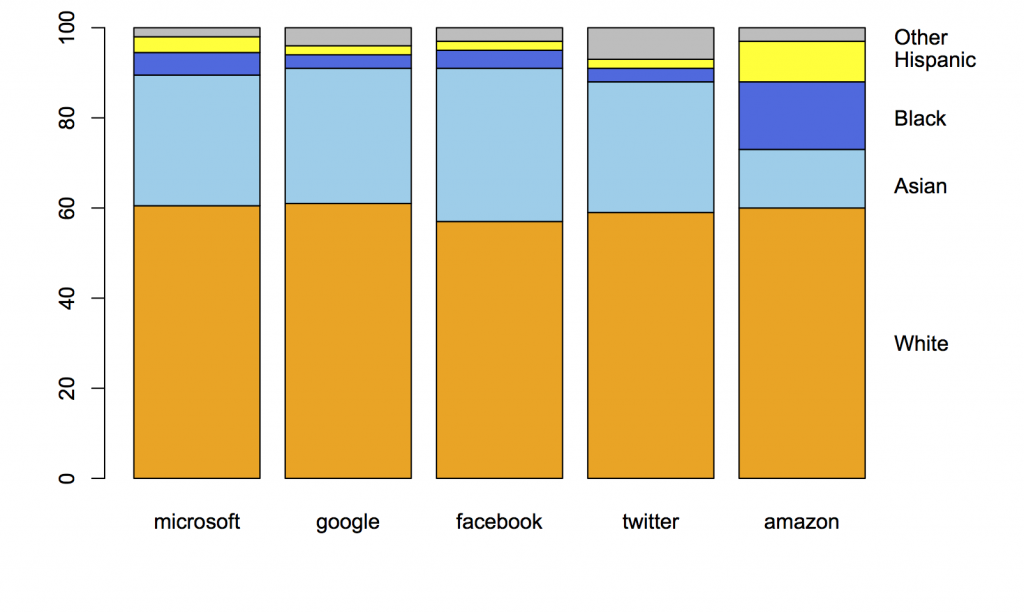
In contrast to Kirsty Johnson’s pie charts last week, where subtlety would have been wasted  given the data and the point she was making, here I think it’s more useful to have the context of the other companies and something that’s better numerically than a pie chart.

This is what the original figures looked like:

amazon-1

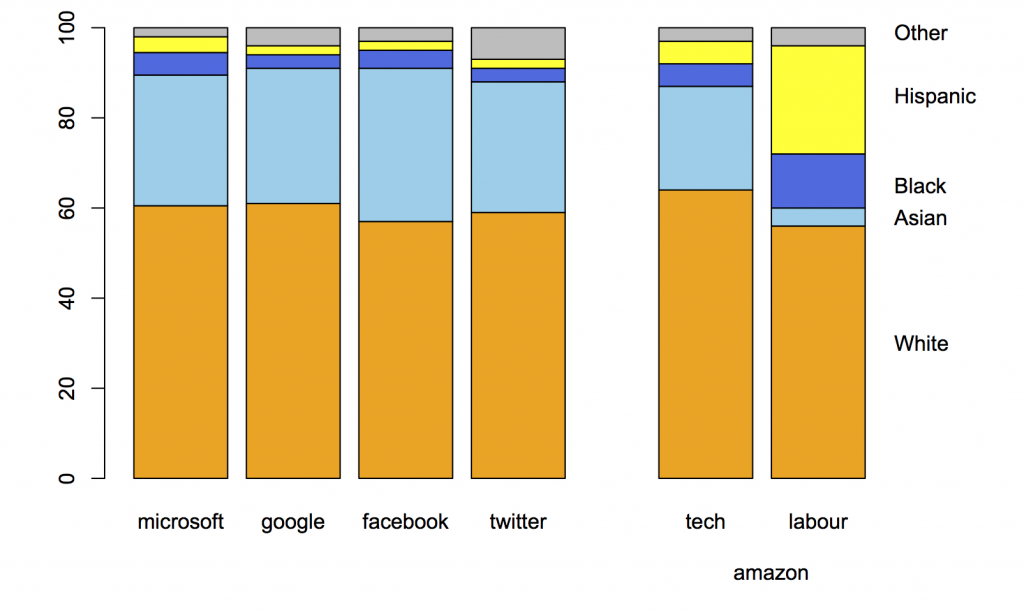
Here’s the same thing with the breakdown of Amazon employees into two groups:

amazon-2

When you compare the tech-company half of Amazon to other large tech companies, it blends in smoothly.

As a final point, “diversity” is really the wrong word here. The racial/ethnic diversity of the tech companies is pretty close to that of the US labour force, if you measure in any of the standard ways used in ecology or data mining, such as entropy or Simpson’s index.   The issue isn’t diversity but equal opportunity; the campaigners, led by Jesse Jackson, are clear on this point, but the tech companies and often the media prefer to talk about diversity.


Stat of the Week Competition: August 15 – 21 2015

Each week, we would like to invite readers of Stats Chat to submit nominations for our Stat of the Week competition and be in with the chance to win an iTunes voucher.

Here’s how it works:

  • Anyone may add a comment on this post to nominate their Stat of the Week candidate before midday Friday August 21 2015.
  • Statistics can be bad, exemplary or fascinating.
  • The statistic must be in the NZ media during the period of August 15 – 21 2015 inclusive.
  • Quote the statistic, when and where it was published and tell us why it should be our Stat of the Week.

Next Monday at midday we’ll announce the winner of this week’s Stat of the Week competition, and start a new one.

(more…)

Stat of the Week Competition Discussion: August 15 – 21 2015

If you’d like to comment on or debate any of this week’s Stat of the Week nominations, please do so below!

August 14, 2015

Briefly

  • “As the polar ice caps melt and the earth churns through the Sixth Extinction, another unprecedented phenomenon is taking place, in the realm of sex,” says Vanity Fair.Yeah, nah” says New York magazine. If you only talk to top Tindr users, (especially in New York) you’re going to get strange ideas about sex.
  • “How Statistics guided me through life, death, and ‘The Price is Right'” by Elisa Long, in Washington Post. Dr Long writes about her breast cancer and her appearance on the famous US game show.
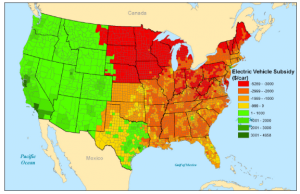
  • At Vox EU, an analysis of the environmental benefits or otherwise of electric cars. The cars don’t emit any pollution as they run, but the power has to come from somewhere. In about half of the US, enough of the electricity comes from coal to make electric cars worse than efficient petrol or diesel cars. In NZ my impression is that a predictable night-time load would largely come from hydro, so electric cars would be green. In Australia, probably not.
    holland fig1 7 aug
  • You probably saw the Herald story on speeding by NZTA staff. A nice example of using data (obtained under the Official Information Act) to show the extent of an issue

Sometimes a pie chart is enough

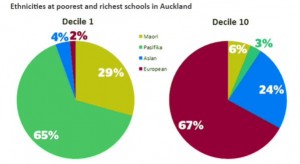
From Kirsty Johnson, in the Herald, ethnicity in the highest and lowest decile schools in Auckland.

CMUU_JjUYAAsWbG

Statisticians don’t like pie charts because they are inefficient; they communicate numerical information less effectively than other forms, and don’t show subtle differences well.  Sometimes the differences are sufficiently unsubtle that a pie chart works.

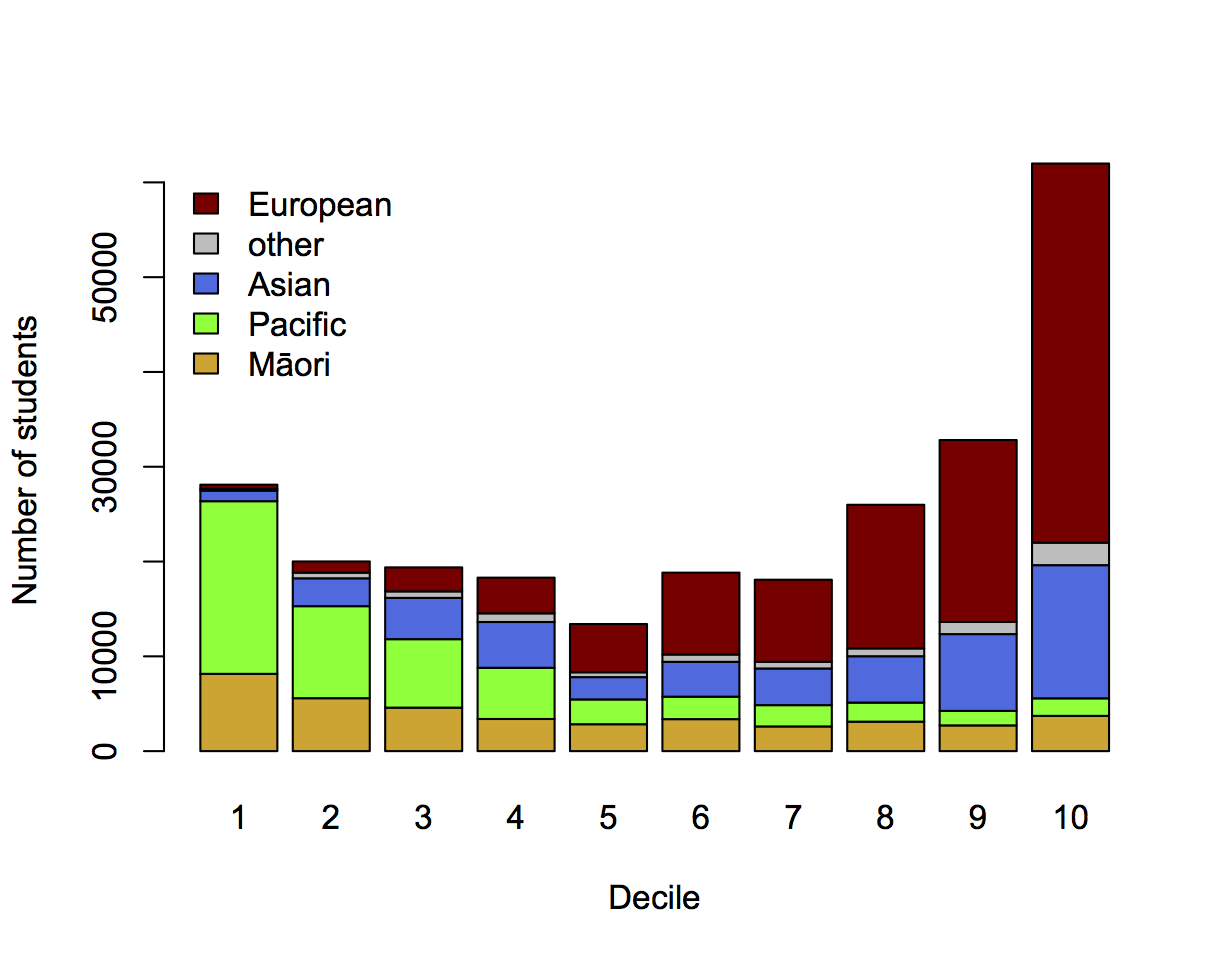
It’s still usually not ideal to show just the two extreme ends of a spectrum, just as it’s usually a bad idea to show just two points in a time series. Here’s the full spectrum, with data from EducationCounts

ethdec


[The Herald has shown the detailed school ethnicity data before in other contexts, eg the decile drift story and graphics from Nicholas Jones and Harkanwal Singh last year]

I’ve used counts rather than percentages to emphasise the variation in student numbers between deciles. The pattern of Māori and Pacific representation is clearly different in this graph: the numbers of Pacific students fall off dramatically as you move up the ranking, but the numbers of Māori students stabilise. There are almost half as many Māori students in decile 10 as in decile 1, but only a tenth as many Pacific students.

If you’re interested in school diversity, the percentages are the right format, but if you’re interested in social stratification, you probably want to know how students of different ethnicities are distributed across deciles, so the absolute numbers are relevant.


August 12, 2015

ITM Cup Predictions for Round 1

Team Ratings for Round 1

Here are the team ratings prior to Round 1, along with the ratings at the start of the season. I have created a brief description of the method I use for predicting rugby games. Go to my Department home page to see this.

Here are the team ratings prior to this week’s games, along with the ratings at the start of the season.

Current Rating Rating at Season Start Difference
Tasman 12.86 12.86 0.00
Canterbury 10.90 10.90 0.00
Counties Manukau 7.86 7.86 0.00
Taranaki 7.70 7.70 0.00
Auckland 5.14 5.14 0.00
Hawke’s Bay -0.57 -0.57 0.00
Manawatu -1.52 -1.52 0.00
Northland -3.64 -3.64 0.00
Wellington -4.62 -4.62 0.00
Otago -4.84 -4.84 0.00
Southland -6.01 -6.01 0.00
Waikato -6.96 -6.96 0.00
Bay of Plenty -9.77 -9.77 0.00
North Harbour -10.54 -10.54 0.00


Predictions for Round 1

Here are the predictions for Round 1. The prediction is my estimated expected points difference with a positive margin being a win to the home team, and a negative margin a win to the away team.

Game Date Winner Prediction
1 Southland vs. Auckland Aug 13 Auckland -7.20
2 Waikato vs. Tasman Aug 14 Tasman -15.80
3 Bay of Plenty vs. North Harbour Aug 14 Bay of Plenty 4.80
4 Taranaki vs. Wellington Aug 15 Taranaki 16.30
5 Otago vs. Canterbury Aug 15 Canterbury -11.70
6 Counties Manukau vs. Manawatu Aug 16 Counties Manukau 13.40
7 Hawke’s Bay vs. Northland Aug 16 Hawke’s Bay 7.10