More diversity pie-charts
These ones are from the Seattle Times, since that’s where I was last week.
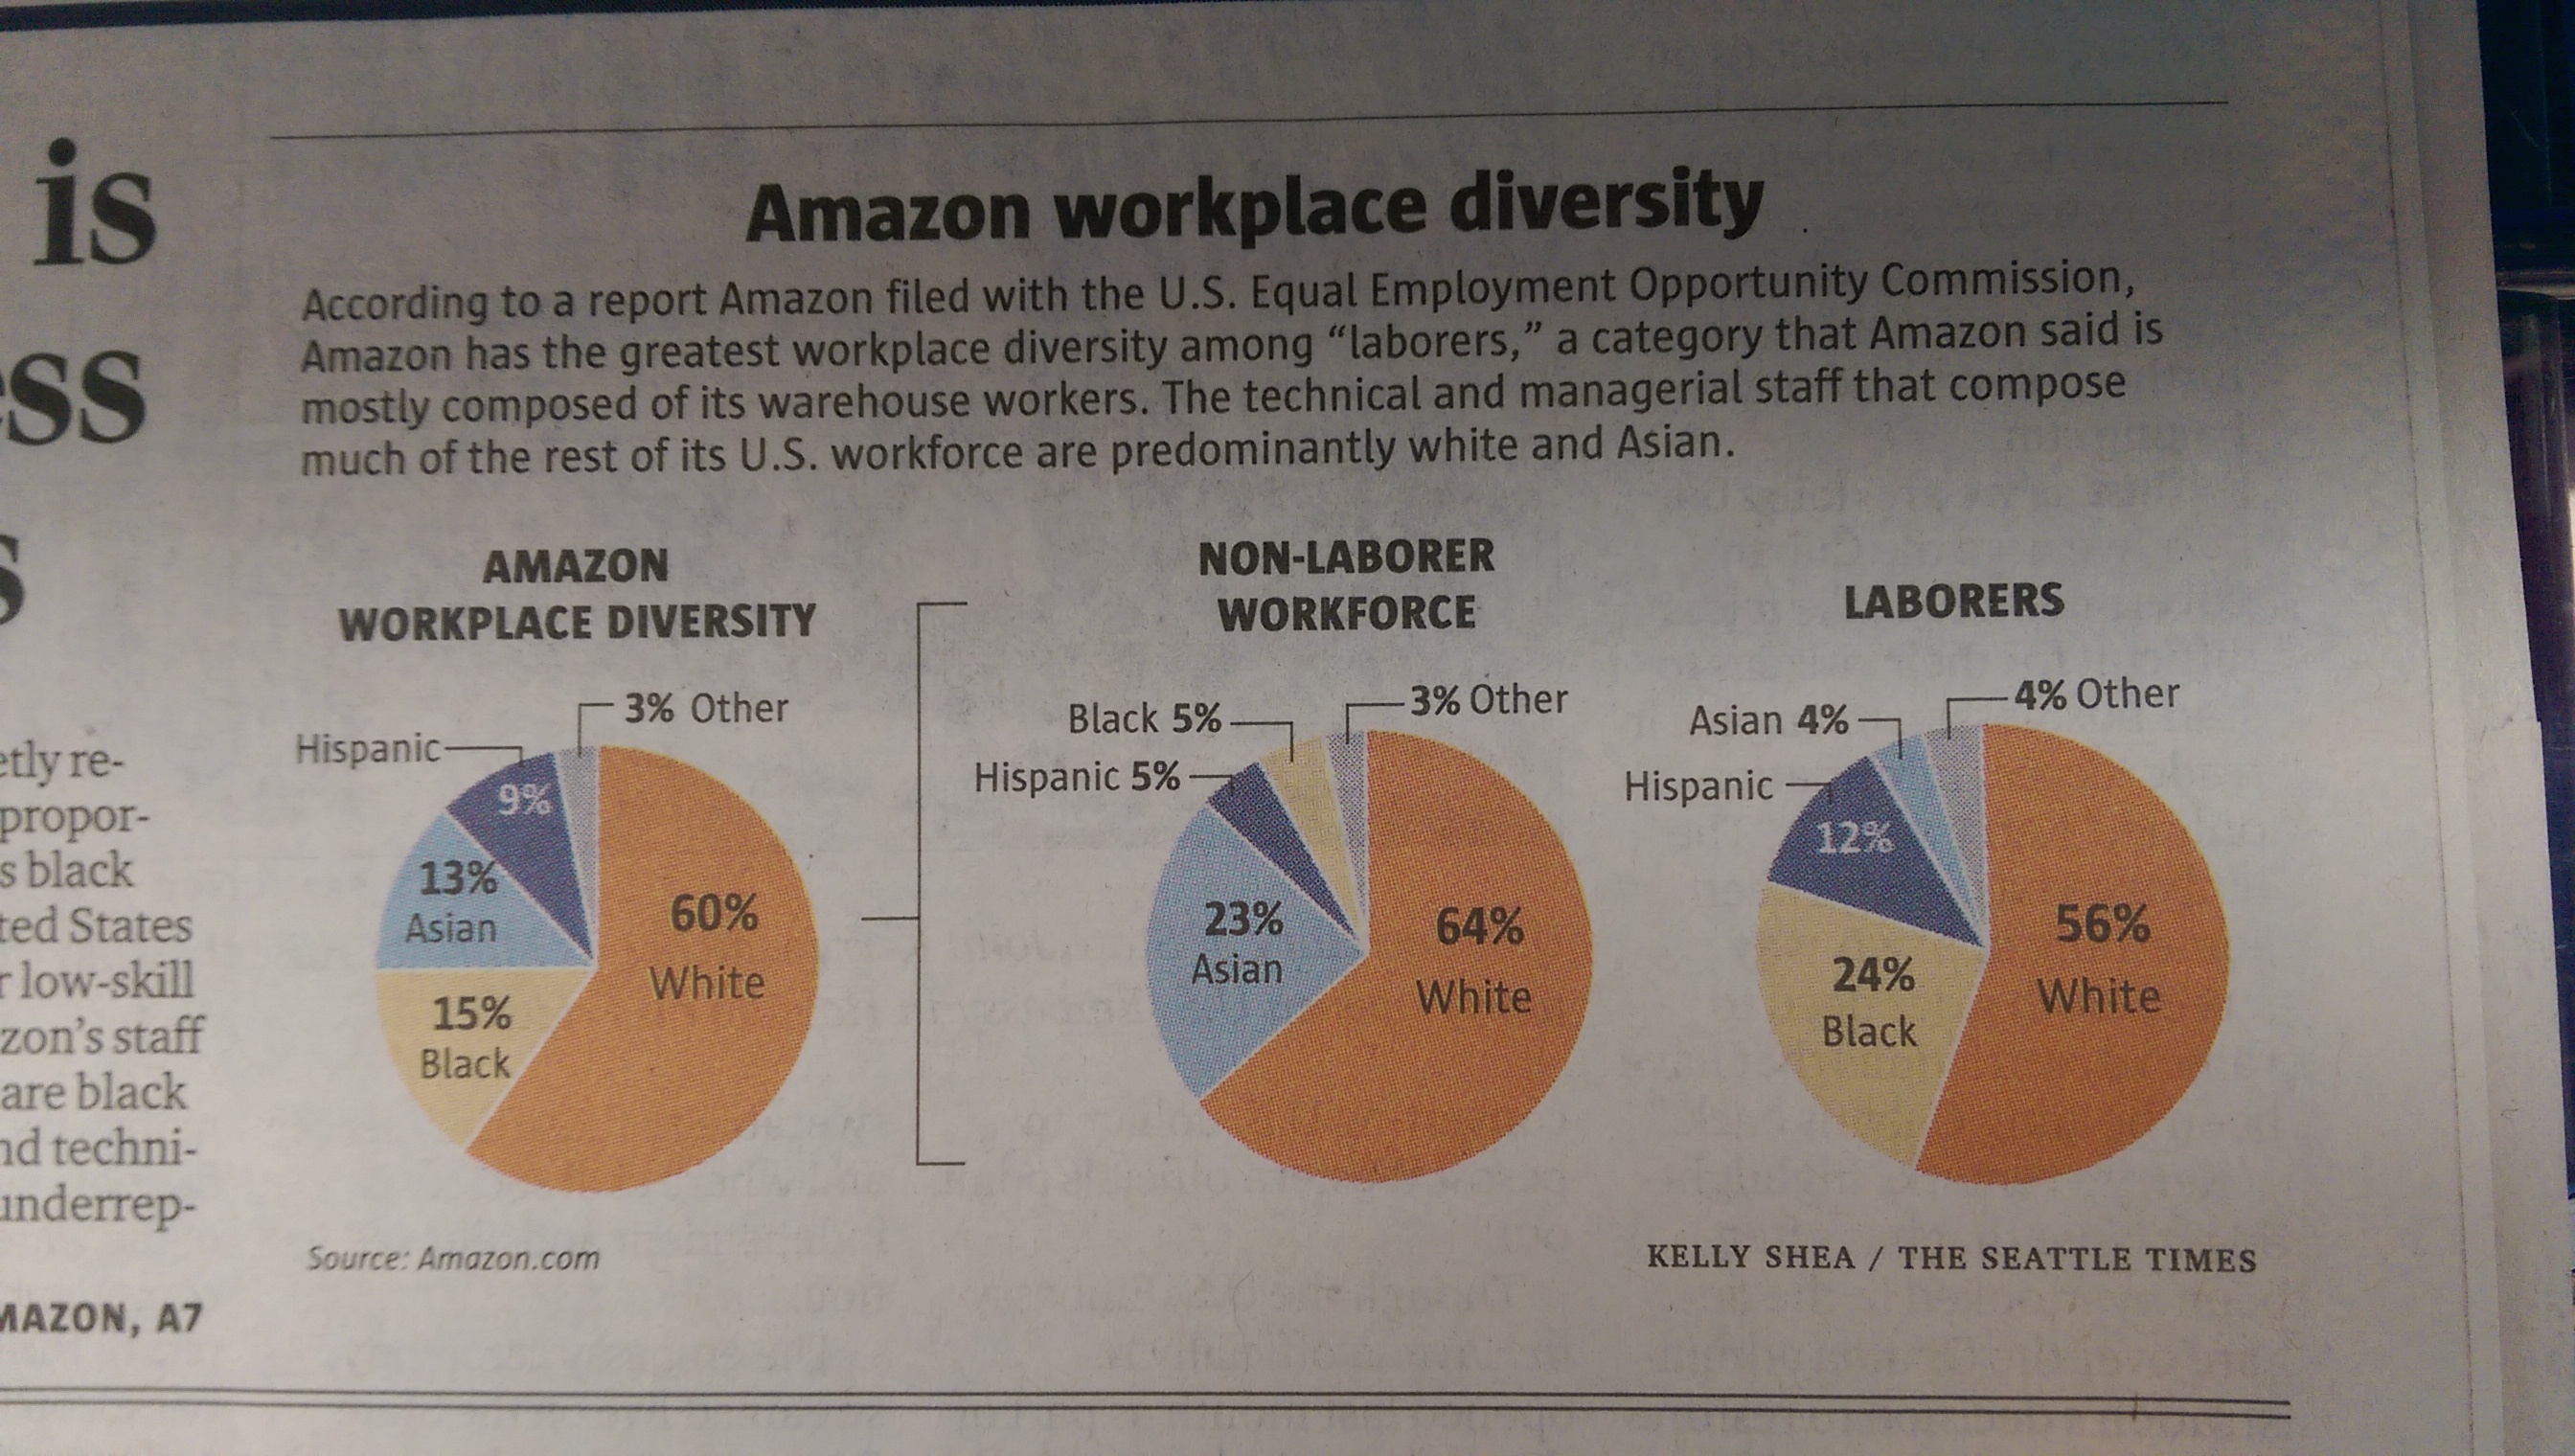
Amazon.com, like many other tech companies, had been persuaded to release figures on gender and ethnicity for its employees. On the original figures, Amazon looked different from the other companies, but Amazon is unusual in being a shipping-things-around company as well as a tech company. Recently, they released separate figures for the ‘labourers and helpers’ vs the technical and managerial staff. The pie chart shows how the breakdown makes a difference.
In contrast to Kirsty Johnson’s pie charts last week, where subtlety would have been wasted given the data and the point she was making, here I think it’s more useful to have the context of the other companies and something that’s better numerically than a pie chart.
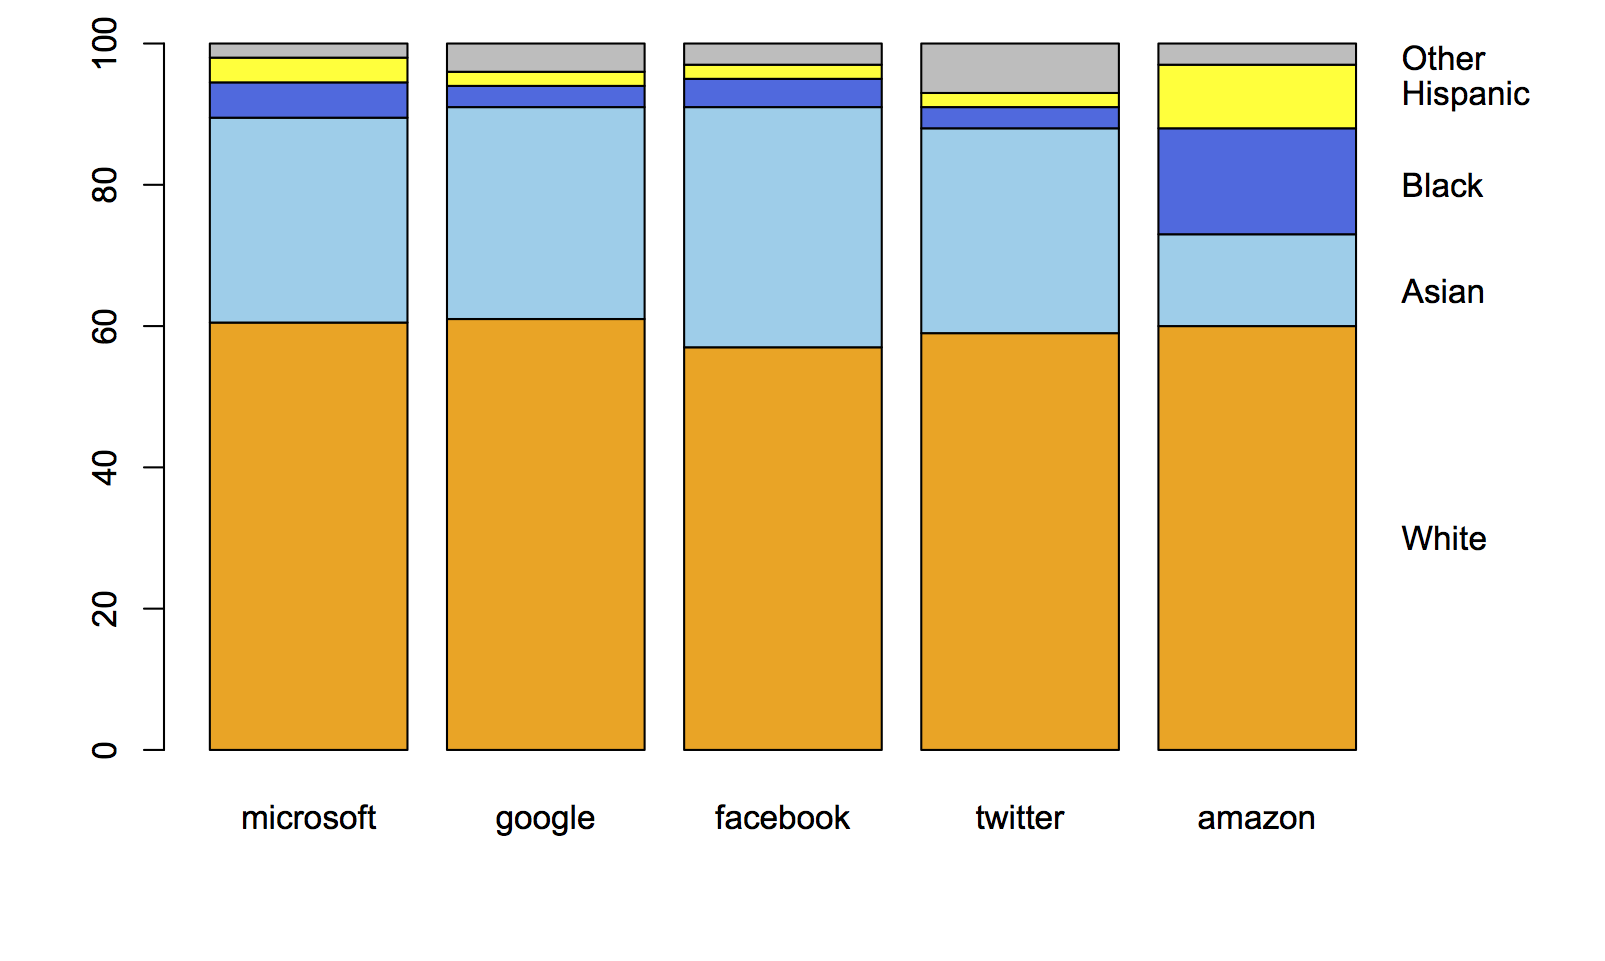
This is what the original figures looked like:
Here’s the same thing with the breakdown of Amazon employees into two groups:
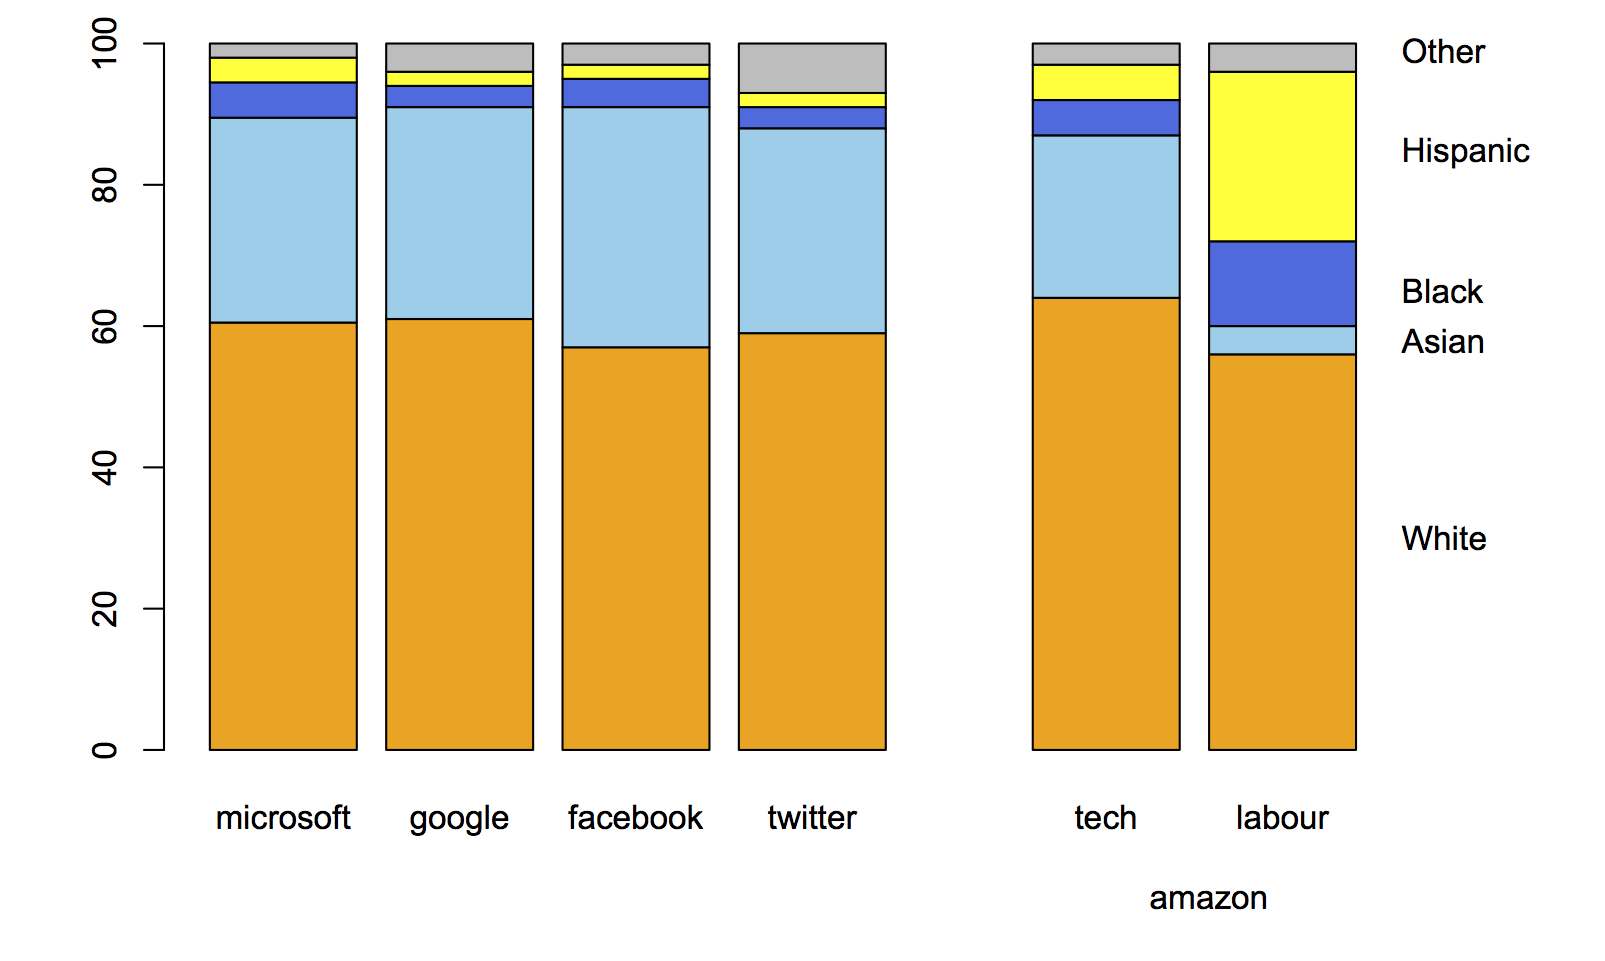
When you compare the tech-company half of Amazon to other large tech companies, it blends in smoothly.
As a final point, “diversity” is really the wrong word here. The racial/ethnic diversity of the tech companies is pretty close to that of the US labour force, if you measure in any of the standard ways used in ecology or data mining, such as entropy or Simpson’s index. The issue isn’t diversity but equal opportunity; the campaigners, led by Jesse Jackson, are clear on this point, but the tech companies and often the media prefer to talk about diversity.
Thomas Lumley (@tslumley) is Professor of Biostatistics at the University of Auckland. His research interests include semiparametric models, survey sampling, statistical computing, foundations of statistics, and whatever methodological problems his medical collaborators come up with. He also blogs at Biased and Inefficient See all posts by Thomas Lumley »
Amazon employees are different in a lot of other ways too
http://www.nytimes.com/2015/08/16/technology/inside-amazon-wrestling-big-ideas-in-a-bruising-workplace.html
11 years ago
I think you switched black and Hispanic in the last chart (labour)
11 years ago