Posts from October 2016 (37)

October 24, 2016

Briefly

  • I would never have guessed this was a problem, but “Data from three national surveys indicated that people are unaware that age is a risk factor for cancer. Moreover, those who were least aware perceived the highest risk of cancer regardless of age.” (free abstract but paywalled paper, via @RolfDegen)
  • Useful graph of uncertainty in vote margin and winner from Nate Silver on Twitter.
    us-uncertainty
  • There’s a computer-personalised education system supported by Facebook that seems to be getting good results. On the other hand, the evidence for the effectiveness isn’t very good quality, and the handling of data privacy is weak. There’s going to be a lot of this sort of issue coming up in the data-based policy world. (Washington Post)

Stat of the Week Competition: October 22 – 28 2016

Each week, we would like to invite readers of Stats Chat to submit nominations for our Stat of the Week competition and be in with the chance to win an iTunes voucher.

Here’s how it works:

  • Anyone may add a comment on this post to nominate their Stat of the Week candidate before midday Friday October 28 2016.
  • Statistics can be bad, exemplary or fascinating.
  • The statistic must be in the NZ media during the period of October 22 – 28 2016 inclusive.
  • Quote the statistic, when and where it was published and tell us why it should be our Stat of the Week.

Next Monday at midday we’ll announce the winner of this week’s Stat of the Week competition, and start a new one.

(more…)

Stat of the Week Competition Discussion: October 22 – 28 2016

If you’d like to comment on or debate any of this week’s Stat of the Week nominations, please do so below!

October 23, 2016

Psychic meerkats and Halloween masks

Prediction is hard — especially,  as the Danish proverb says, when it comes to the future. In the Rugby World Cup we had psychic meerkats. For the US elections the new bogus prediction trend is Halloween masks: allegedly, more masks are sold with the face of the candidate who goes on to win.

The first question with a claim like this one, especially given some of the people making it, is whether the historical claim is true.  In this case it’s true-ish.  The claim was made before the 2012 election, and while the data aren’t comprehensive, they are from the same big chain of stores each year. From 1980 to 2012, the mask rule has predicted the eventual winner of the presidency.  That’s actually an argument against it.

If there’s more to the mask sales than there is to psychic meerkats, it would have to be as a prediction of the popular vote — you’d need data from individual states to predict the weird US Electoral College. But if the mask rule got the 2000 election right, it must have got the popular vote wrong that year — George W. Bush won the electoral college, but lost the popular vote to Al Gore. From that point of view, we’re looking at 8 out of 9.

More importantly, 9 out of 9 isn’t all that impressive. Suppose you got your predictions by flipping a coin.  Your chance of getting either all heads for the Republican wins or all heads for the Democratic wins is 1 in 256, increasing to 1 in 128 if you’re allowed to choose which way to treat the 2000 election.  The chance of getting 8 of 9 agreement is much better: about 1 in 13.  If only one in a million people in the US had tried coming up with just one prediction rule each, you’d expect someone to get it perfect and dozens to get it nearly right.

Given these odds, it wouldn’t be surprising if, say, a US professional sports team had results agreeing with the Presidential results — and in fact, there was a rule based on the results for the Washington Redskins football team that worked from 1940 to 2000, was fudged to work in 2004, and then failed completely in 2012.    That’s 17/19 correct, but since the rule was first publicised in the run-up to the 2000 election, it’s 2/4 correct in actual use.

If you’re allowed to combine multiple variables it gets even easier to find rules. With anything from basic linear regression to a neural network you’d expect to get perfect prediction from five unrelated variables. Even restricting the models to be simple doesn’t help much.  I downloaded some OECD data on national GDP for various countries, and found that since 1980 the Republicans have won the popular vote precisely in years when the GDP of Sweden increased more than the GDP of Norway.

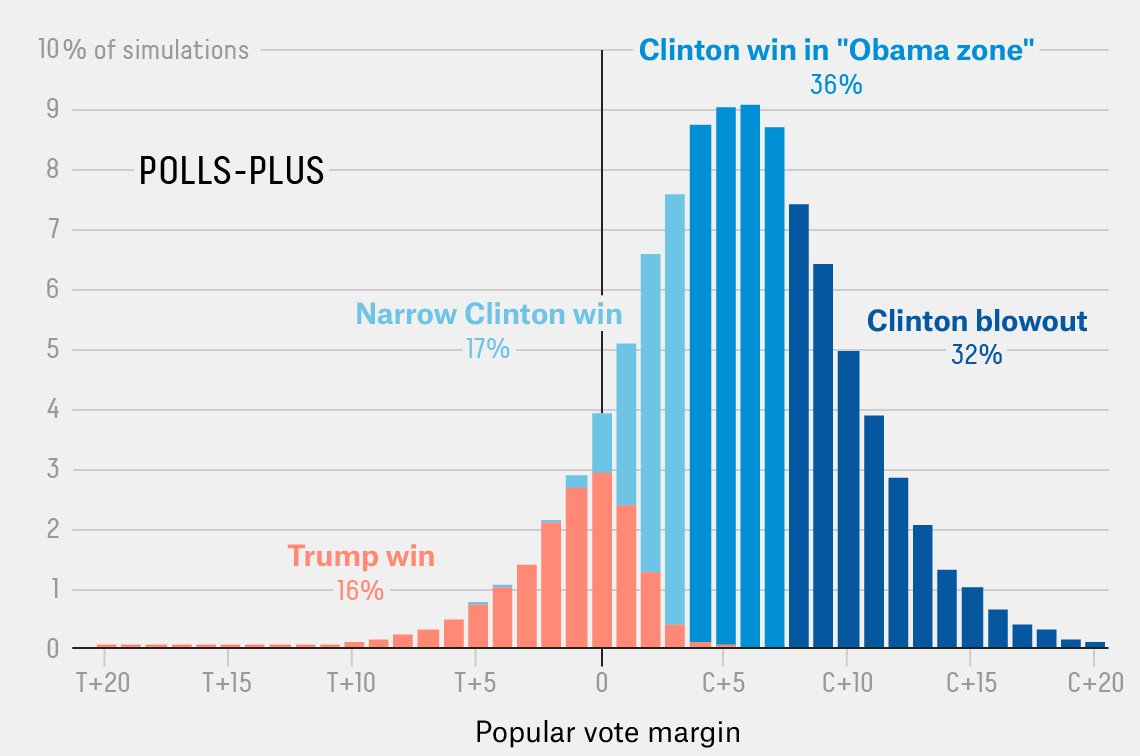
My advice is to stick with the psychic meerkats for entertainment and the opinion poll aggregators or the betting markets for prediction.

October 22, 2016

Stat of the Week fixed

Because of changes at WordPress, the Stat of the Week competition has been eating the URLs you submitted.

Um.

Sorry.


We’ve fixed it now.

Cheese addiction hoax again

Three more sites have fallen for the cheese addiction hoax

As you may remember, this story is very very loosely based on real research from the University of Michigan. However, the hoax version misrepresents which foods were most addictive and makes up an explanation based on the milk protein casein that isn’t mentioned in the real research at all.

The reason I’m calling this a hoax is that it wasn’t the fault of the researchers, their institution, or the journal, and it’s obvious to anyone who makes any attempt to scan the research paper that it doesn’t support the story. It isn’t an innocent mistake, and it isn’t a simple exaggeration like most misleading health science stories.

There’s a good post at Science News describing what was actually found.

October 20, 2016

Brute force and ignorance

At a conference earlier this week, a research team from Microsoft described a computer system for speech transcription. For the first time ever, this system did better than humans on a standard set of recordings.

What’s more impressive — and StatsChat relevant — is that this computer system does not understand anything about the conversations it writes down. The system does not know English, or any other human language, even in the sense that Siri does.

It has some preconceived notions about what tends to follow a particular word, pair of words, or triple of words, and about what sequences of sounds tend to follow each other, but nothing about nouns or verbs or how colorless green ideas sleep. As with modern image recognition, the system is just based on heaps and heaps of data and powerful computers.  It’s computing and statistics, not linguistics.

In a comment to a post at Language Log, the linguist Geoffrey Pullum says

I must confess that I never thought I would see this day. In the 1980s, I judged fully automated recognition of connected speech (listening to connected conversational speech and writing down accurately what was said) to be too difficult for machines, far more difficult than syntactic and semantic processing (taking an error-free written sentence as input, recognizing which sentence it was, analysing it into its structural parts, and using them to figure out its literal meaning). I thought the former would never be accomplished without reliance on the latter.

There are many problems where enough data is not available to construct a model with no understanding of the problem. There won’t be a shortage of work for human statisticians or linguists any time soon. But there are problems where brute force and ignorance works, and they aren’t always the ones we expect.

October 18, 2016

Evidence-based policy chants

An old one, seen at the ‘Rally To Restore Sanity and/or Fear”

What do we want?
EVIDENCE-BASED CHANGE!

When do we want it?
AFTER PEER REVIEW!


A new one, from @zentree and @bex_stevenson on Twitter

What do we want?
RELIABLE NUMBERS!

When do we want them?
STAT!

(this sort of thing is why we have a ‘Silly’ tag on StatsChat)

The lack of change is the real story

The Chief Coroner has released provisional suicide statistics for the year to June 2016.  As I wrote last year, the rate of suicide in New Zealand is basically not changing.  The Herald’s story, by Martin Johnston, quotes the Chief Coroner on this point

“Judge Marshall interpreted the suicide death rate as having remained consistent and said it showed New Zealand still had a long way to go in turning around the unacceptably high toll of suicide.”

The headline and graphs don’t make this clear

Here’s the graph from the Herald

suicide-herald

If you want a bar graph, it should go down to zero, and it would then show how little is changing

suicide-2

I’d prefer a line graph showing expected variation if there wasn’t any underlying change: the shading is one and two standard deviations around the average of the nine years’ rates

suicide-3

As Judge Marshall says, the suicide death rate has remained consistent. That’s our problem.  Focusing on the year to year variation misses the key point.

Mitre 10 Cup Predictions for the Mitre 10 Cup Semi-Finals

Team Ratings for the Mitre 10 Cup Semi-Finals

The basic method is described on my Department home page.

Here are the team ratings prior to this week’s games, along with the ratings at the start of the season.

Current Rating Rating at Season Start Difference
Canterbury 14.27 12.85 1.40
Tasman 9.18 8.71 0.50
Taranaki 8.78 8.25 0.50
Auckland 6.55 11.34 -4.80
Counties Manukau 6.15 2.45 3.70
Otago 0.63 0.54 0.10
Waikato -0.37 -4.31 3.90
Wellington -0.86 4.32 -5.20
North Harbour -3.39 -8.15 4.80
Manawatu -3.94 -6.71 2.80
Bay of Plenty -4.43 -5.54 1.10
Hawke’s Bay -5.76 1.85 -7.60
Northland -13.35 -19.37 6.00
Southland -16.96 -9.71 -7.30


Performance So Far

So far there have been 70 matches played, 50 of which were correctly predicted, a success rate of 71.4%. Here are the predictions for last week’s games.

Game Date Score Prediction Correct
1 North Harbour vs. Tasman Oct 12 27 – 27 -8.30 FALSE
2 Taranaki vs. Auckland Oct 13 35 – 32 6.90 TRUE
3 Manawatu vs. Otago Oct 14 14 – 21 0.80 FALSE
4 Counties Manukau vs. Canterbury Oct 15 33 – 21 -7.70 FALSE
5 Hawke’s Bay vs. Bay of Plenty Oct 15 24 – 26 3.70 FALSE
6 Wellington vs. Waikato Oct 15 24 – 28 5.20 FALSE
7 Tasman vs. Southland Oct 16 56 – 0 25.20 TRUE
8 Northland vs. North Harbour Oct 16 28 – 44 -3.00 TRUE


Predictions for the Mitre 10 Cup Semi-Finals

Here are the predictions for the Mitre 10 Cup Semi-Finals. The prediction is my estimated expected points difference with a positive margin being a win to the home team, and a negative margin a win to the away team.

Game Date Winner Prediction
1 Otago vs. Bay of Plenty Oct 21 Otago 9.10
2 Wellington vs. North Harbour Oct 22 Wellington 6.50
3 Canterbury vs. Counties Manukau Oct 23 Canterbury 12.10
4 Taranaki vs. Tasman Oct 23 Taranaki 3.60