Posts from April 2017 (34)

April 17, 2017

NRL Predictions for Round 8

Team Ratings for Round 8

The basic method is described on my Department home page.

Here are the team ratings prior to this week’s games, along with the ratings at the start of the season.

Current Rating Rating at Season Start Difference
Raiders 9.43 9.94 -0.50
Storm 8.41 8.49 -0.10
Sharks 8.11 5.84 2.30
Broncos 5.26 4.36 0.90
Cowboys 2.54 6.90 -4.40
Panthers 1.56 6.08 -4.50
Dragons 0.97 -7.74 8.70
Roosters 0.50 -1.17 1.70
Bulldogs -1.74 -1.34 -0.40
Sea Eagles -1.85 -2.98 1.10
Eels -2.15 -0.81 -1.30
Rabbitohs -3.33 -1.82 -1.50
Titans -3.83 -0.98 -2.90
Warriors -5.60 -6.02 0.40
Wests Tigers -5.66 -3.89 -1.80
Knights -14.66 -16.94 2.30


Performance So Far

So far there have been 56 matches played, 32 of which were correctly predicted, a success rate of 57.1%.
Here are the predictions for last week’s games.

Game Date Score Prediction Correct
1 Bulldogs vs. Rabbitohs Apr 14 24 – 9 3.20 TRUE
2 Knights vs. Roosters Apr 14 6 – 24 -10.40 TRUE
3 Broncos vs. Titans Apr 14 24 – 22 14.60 TRUE
4 Sea Eagles vs. Storm Apr 15 26 – 36 -6.10 TRUE
5 Raiders vs. Warriors Apr 15 20 – 8 20.40 TRUE
6 Dragons vs. Cowboys Apr 15 28 – 22 1.00 TRUE
7 Panthers vs. Sharks Apr 16 2 – 28 1.10 FALSE
8 Eels vs. Wests Tigers Apr 17 26 – 22 7.70 TRUE


Predictions for Round 8

Here are the predictions for Round 8. The prediction is my estimated expected points difference with a positive margin being a win to the home team, and a negative margin a win to the away team.

Game Date Winner Prediction
1 Raiders vs. Sea Eagles Apr 21 Raiders 14.80
2 Rabbitohs vs. Broncos Apr 21 Broncos -5.10
3 Eels vs. Panthers Apr 22 Panthers -0.20
4 Cowboys vs. Knights Apr 22 Cowboys 20.70
5 Sharks vs. Titans Apr 22 Sharks 15.40
6 Wests Tigers vs. Bulldogs Apr 23 Bulldogs -0.40
7 Roosters vs. Dragons Apr 25 Roosters 3.00
8 Storm vs. Warriors Apr 25 Storm 18.00


Super 18 Predictions for Round 9

Team Ratings for Round 9

The basic method is described on my Department home page.

Here are the team ratings prior to this week’s games, along with the ratings at the start of the season.

Current Rating Rating at Season Start Difference
Hurricanes 16.41 13.22 3.20
Crusaders 10.32 8.75 1.60
Chiefs 10.03 9.75 0.30
Highlanders 8.29 9.17 -0.90
Lions 7.95 7.64 0.30
Stormers 3.88 1.51 2.40
Brumbies 3.73 3.83 -0.10
Blues 2.40 -1.07 3.50
Waratahs 1.24 5.81 -4.60
Sharks 1.05 0.42 0.60
Jaguares -2.12 -4.36 2.20
Bulls -2.58 0.29 -2.90
Force -8.75 -9.45 0.70
Cheetahs -9.90 -7.36 -2.50
Reds -10.42 -10.28 -0.10
Rebels -11.76 -8.17 -3.60
Kings -17.38 -19.02 1.60
Sunwolves -19.50 -17.76 -1.70


Performance So Far

So far there have been 63 matches played, 49 of which were correctly predicted, a success rate of 77.8%.
Here are the predictions for last week’s games.

Game Date Score Prediction Correct
1 Crusaders vs. Sunwolves Apr 14 50 – 3 32.00 TRUE
2 Reds vs. Kings Apr 15 47 – 34 10.70 TRUE
3 Blues vs. Hurricanes Apr 15 24 – 28 -11.40 TRUE
4 Rebels vs. Brumbies Apr 15 19 – 17 -13.90 FALSE
5 Cheetahs vs. Chiefs Apr 15 27 – 41 -16.20 TRUE
6 Stormers vs. Lions Apr 15 16 – 29 1.10 FALSE
7 Bulls vs. Jaguares Apr 15 26 – 13 2.30 TRUE


Predictions for Round 9

Here are the predictions for Round 9. The prediction is my estimated expected points difference with a positive margin being a win to the home team, and a negative margin a win to the away team.

Game Date Winner Prediction
1 Hurricanes vs. Brumbies Apr 21 Hurricanes 16.70
2 Lions vs. Jaguares Apr 21 Lions 14.10
3 Highlanders vs. Sunwolves Apr 22 Highlanders 31.80
4 Crusaders vs. Stormers Apr 22 Crusaders 10.40
5 Waratahs vs. Kings Apr 22 Waratahs 22.60
6 Force vs. Chiefs Apr 22 Chiefs -14.80
7 Bulls vs. Cheetahs Apr 22 Bulls 10.80
8 Sharks vs. Rebels Apr 22 Sharks 16.80


Stat of the Week Competition: April 15 – 21 2017

Each week, we would like to invite readers of Stats Chat to submit nominations for our Stat of the Week competition and be in with the chance to win an iTunes voucher.

Here’s how it works:

  • Anyone may add a comment on this post to nominate their Stat of the Week candidate before midday Friday April 21 2017.
  • Statistics can be bad, exemplary or fascinating.
  • The statistic must be in the NZ media during the period of April 15 – 21 2017 inclusive.
  • Quote the statistic, when and where it was published and tell us why it should be our Stat of the Week.

Next Monday at midday we’ll announce the winner of this week’s Stat of the Week competition, and start a new one.

(more…)

Stat of the Week Competition Discussion: April 15 – 21 2017

If you’d like to comment on or debate any of this week’s Stat of the Week nominations, please do so below!

Slow on the uptake

Q: Did you see gin can increase your metabolism?

A: Um…

Q: Here, in the Herald, new research from Latvia!

A:  Not really convincing.

Q: Why? Is it in mice?

A: Up to a point.

Q: <reads> Yes, it’s in mice: “In fact, the mice who were fed regular doses of the spirit saw a 17 percent increase in their metabolic rate”.  That’s a lot, isn’t it?

A: Indeed. One might almost say an incredible amount.

Q:  Ok, were these some special sort of mutant mouse with a weird metabolism?

A: The story doesn’t seem to say.

Q: Of course it doesn’t, but can’t you find the original research paper? The story says it’s in Food & Nature. Doesn’t University of Auckland subscribe to it?

A: No.

Q: That’s usually a bad sign, isn’t it?

A: Especially in this case. The journal doesn’t exist, the university doesn’t exist, and Professor Thisa Lye is, apparently a lie.

Q:  😕?

A: The story is two weeks old. It was an April Fool’s hoax. Thanks to Elle Hunt I was saved potentially quite a bit of time looking for the journal. She tweeted a link from Latvian Public Broadcasting, who have tracked the story down.

Q: So the Herald got it from the Daily Mail who got it from Yahoo who got it from Prima. And none of them checked that the research existed? I mean, ok, checking science isn’t what journalists are trained to do, but checking that sources actually exist? With Google?

A:  On the positive side, no mice were harmed in conducting the research.

April 14, 2017

Cyclone uncertainty

Cyclone Cook ended up a bit east of where it was expected, and so Auckland had very little damage.  That’s obviously a good thing for Auckland, but it would be even better if we’d had no actual cyclone and no forecast cyclone.  Whether the precautions Auckland took were necessary (at the time) or a waste  depends on how much uncertainty there was at the time, which is something we didn’t get a good idea of.

In the southeastern USA, where they get a lot of tropical storms, there’s more need for forecasters to communicate uncertainty and also more opportunity for the public to get to understand what the forecasters mean.  There’s scientific research into getting better forecasts, but also into explaining them better. Here’s a good article at Scientific American

Here’s an example (research page):

hurricane

On the left is the ‘cone’ graphic currently used by the National Hurricane Center. The idea is that the current forecast puts the eye of the hurricane on the black line, but it could reasonably be anywhere in the cone. It’s like the little blue GPS uncertainty circles for maps on your phone — except that it also could give the impression of the storm growing in size.  On the right is a new proposal, where the blue lines show a random sample of possible hurricane tracks taking the uncertainty into account — but not giving any idea of the area of damage around each track.

There’s also uncertainty in the predicted rainfall.  NIWA gave us maps of the current best-guess predictions, but no idea of uncertainty.  The US National Weather Service has a new experimental idea: instead of giving maps of the best-guess amount, give maps of the lower and upper estimates, titled: “Expect at least this much” and “Potential for this much”.

In New Zealand, uncertainty in rainfall amount would be a good place to start, since it’s relevant a lot more often than cyclone tracks.

Update: I’m told that the Met Service do produce cyclone track forecasts with uncertainty, so we need to get better at using them.  It’s still likely more useful to experiment with rainfall uncertainty displays, since we get heavy rain a lot more often than cyclones. 

April 12, 2017

Criteria for criteria for mānuka honey

There’s a new proposed definition of NZ Mānuka Honey, as you may have seen. The MPI page on the topic is here; no-one is linking it, which is sad because it’s interesting if you’re enough of a nerd.

I’m not going to comment on the biochemistry or botany, but there are two statistically-interesting parts of the proposal.  First, how the statistical method for classifying honey was constructed. The document says:

A classification modelling approach (CART – classification and regression tree) was the most suitable method of analysis for determining the identification criteria for mānuka honey because:

  • test results for several different attributes were available and needed to be assessed in combination;
  • the identification criteria needed to be related to the attributes tested;
  • the identification criteria needed to be straightforward, transparent and easily interpreted
  • the outputs would enable an unknown honey sample to be authenticated as monofloral or multifloral mānuka honey.

CART is a relatively old classification method, developed in the early 1980s by adding statistical ‘pruning’ to automated methods for building decision trees. It hasn’t been the most accurate method in head-to-head prediction competitions for a long time now, but it remains very useful for basically the reasons the MPI scientists gave.  CART tends to end up with simple rules based whether a small selection of variables all or mostly exceed some thresholds, and while building a good CART prediction rule takes experience and statistical knowledge, using it doesn’t.

Using a collection of honey samples from known origins, and other information about chemical composition of the plants, a rule was developed for distinguishing mānuka honey from other NZ honeys such as kānuka or pōhutukawa, and from Leptospermum species other than mānuka. The resulting rule for monofloral (`pure’) mānuka honey is a threshold that four chemicals have to exceed, plus the presence of mānuka DNA.  For multifloral mānuka honey, the threshold for one of the four chemicals is lowered.

The second interesting aspect of the criteria is that none of the four chemicals have anything to do with real or imagined medical benefits of mānuka honey.  Methylglyoxal, the leading candidate for a somewhat mānuka-specific antimicrobial, isn’t in there.  The rule attempts to identify honey produced by bees foraging on mānuka flowers — scientists know what a mānuka flower is. It doesn’t try to identify honey that prevents miscellaneous diseases when you eat it, because no-one one knows what characteristics that honey would have, or even if it exists.

As I’ve noted before, the largest controlled trial of eating mānuka honey to prevent minor illness was conducted by a London primary school. On the other hand, people are willing to pay a lot of money for honey from NZ mānuka, and as long as MPI isn’t officially supporting the health arguments I’m definitely in favour of that money going to NZ apiarists rather than counterfeiters.

Are you related to your ancestors?

Two people have emailed me this story (one via Stuffone via the Herald) about the DNA ancestry of Oriini Kaipara, a TV presenter:

An analysis of the DNA of Oriini Kaipara, 33, has shown that – despite her having both Maori and Pakeha ancestry – her genes only contain Maori DNA. That makes her, in her own words, a “full-blooded Maori”.

Culturally, people identify as Maori through their whakapapa, while legally a person is defined as Maori if they are of Maori descent, even through one long-distant ancestor.

However, the intermingling of different ethnicities in New Zealand over the past 200 years means all Maori people are thought to have some non-Maori ancestry, so would not be expected to have 100 per cent Maori DNA.

It seems strange that someone could have an ancestor from whom they got no DNA, but while most ‘ancestry and genetics’ news stories are completely bogus, this one probably isn’t.

Ignoring the X and Y chromosomes to start with, you have 22 chromosomes from your mother and 22 from your father (except for some rare cases such as people with Down syndrome, who have an extra copy of one of them, usually from their mothers).  Each of your maternal chromosomes is a combination of DNA from your mother’s father and mother’s mother, in chunks averaging about 1/4 chromosome long. Each of your paternal chromosomes is a combination of DNA from your father’s father and father’s mother, in chunks averaging about 1/4  chromosome long.  So, on average, you have 1/4 of your DNA from each grandparent, but it’s random.  You might have only tiny chunks from one grandparent and almost 50% from another.

As we go back further, after N generations you have 2N direct ancestors, but the chunks of DNA being inherited are about 1/2N chromosomes long.  So, going back 10 generations you have 1024 ancestors and you’re inheriting DNA chunks about 1/20th of a chromosome long.   But with 22 pairs of chromosomes, that only allows you to fit in chunks from 20×2×22=880 of your great8-grandparents.   So, you almost certainly have DNA from all your grandparents, and very likely from all your great-grandparents, but it’s unlikely you have DNA from all your ancestors ten generations back, and the proportion you have DNA from goes down and down the further back you go.  Europeans in NZ don’t go all that far back, so the probability is pretty high for any given European ancestor of a modern Māori, but it’s not 100%.

In modern New Zealand, most Māori will have more non-Māori ancestors than Ms Kaipara does, and most people with only two non-Māori ancestors will have inherited DNA from at least one of them, so it would be unusual for someone to have no non-Māori DNA, but certainly not impossible.

The next question is how the genetic testing people can know which DNA came from Māori ancestors.  The DNA bases that end up in a saliva sample are synthesised in your body from the food you eat: they don’t come with little labels saying which ancestor’s DNA they are copies of.  One adenine base looks just like any other.  The approach to this problem is statistical: there are many, many positions in the DNA sequence where particular variations are more common in one part of the world than in others. Some of these are well known because of what they do, but those are a tiny minority; nearly all of them are unimportant copying errors. In any case, two people who share the variant probably got it from the same distant ancestor, so if you collect enough DNA variants from enough people around the world, you can tell with surprising reliability where people’s ancestors came from.

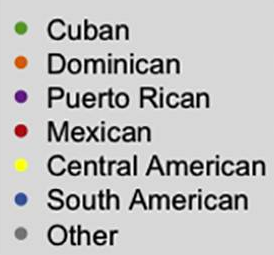
Here’s a picture from research in the USA, showing three genetic summaries for people identifying with various Hispanic/Latinx groups:

hispaniclegend

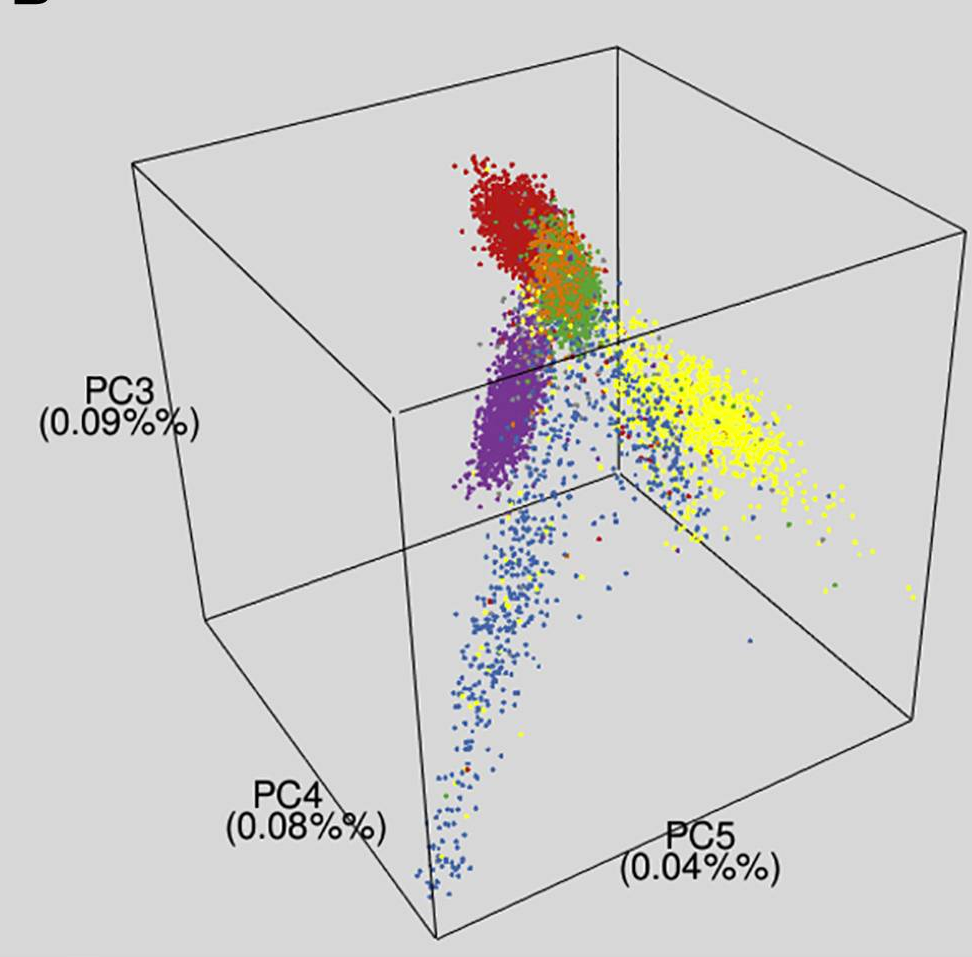
There’s pretty clear separation: in this sample you can tell quite a lot about a typical person’s ancestry from their genes.  No single genetic variant will tell you much, but thousands or millions of them together tell you a lot.  In this example, the three summaries correspond roughly to amounts of ancestry from the Americas before Columbus, from Europe, and from western Africa via the slave trade. are the most important variation after the first three summaries giving basic continental ancestry are taken  out.

The test used by ancestry.com measures 700,000 DNA variants, which is a respectable number.  It’s probably a bit short on markers for Polynesian ancestry, because there hasn’t been much genetic study of Polynesians. It will be very short on markers that distinguish Māori from other people with Polynesian ancestry, but in this example, family history was enough to make that unnecessary.  So, it’s plausible that some Māori have little or no non-Māori DNA, and it’s plausible that ancestry.com could determine that with reasonable reliability: the story is making a claim that has some content and could very well be true.  As the story says, the result doesn’t actually matter much, but it is interesting.

Without Ms Kaipara’s family history, just using genetic data, the video clip says her Polynesian ancestry was estimated as between 93% and 100%: there’s quite a bit of uncertainty.   For someone with a less clearly known family history, or from somewhere that mixing of populations happened longer ago than two centuries, the test will be less informative, but will still give some general information about what parts of the world your ancestors may have come from.  You might still want to know.

What this story should make you concerned about, though, is other news stories talking about someone’s descent from, say, Genghis Khan.  If Ms Kaipara can have recent ancestors whose DNA she doesn’t appear to carry, how can claims from 1000 years in the past be credible? And indeed they aren’t.  As you go back further and further in time,  you have more and more ancestors. By the time of Genghis Khan, there would be tens of billions of them.  Obviously there must be huge overlap, but that still allows you to be descended from a lot of people. Pretty much everyone in Europe and Asia has Genghis Khan as an ancestor; a fraction of them carry DNA descended from his; and a tiny fraction of these have copies of his Y chromosome.  The test results that more often make headlines are the last sort, which are pretty meaningless.


April 11, 2017

Super 18 Predictions for Round 8

Team Ratings for Round 8

The basic method is described on my Department home page.

Here are the team ratings prior to this week’s games, along with the ratings at the start of the season.

Current Rating Rating at Season Start Difference
Hurricanes 16.86 13.22 3.60
Chiefs 10.16 9.75 0.40
Crusaders 9.42 8.75 0.70
Highlanders 8.29 9.17 -0.90
Lions 7.10 7.64 -0.50
Stormers 4.73 1.51 3.20
Brumbies 4.68 3.83 0.90
Blues 1.96 -1.07 3.00
Waratahs 1.24 5.81 -4.60
Sharks 1.05 0.42 0.60
Jaguares -1.48 -4.36 2.90
Bulls -3.22 0.29 -3.50
Force -8.75 -9.45 0.70
Cheetahs -10.03 -7.36 -2.70
Reds -10.56 -10.28 -0.30
Rebels -12.72 -8.17 -4.60
Kings -17.24 -19.02 1.80
Sunwolves -18.61 -17.76 -0.80


Performance So Far

So far there have been 56 matches played, 44 of which were correctly predicted, a success rate of 78.6%.
Here are the predictions for last week’s games.

Game Date Score Prediction Correct
1 Hurricanes vs. Waratahs Apr 07 38 – 28 20.90 TRUE
2 Sunwolves vs. Bulls Apr 08 21 – 20 -13.10 FALSE
3 Highlanders vs. Blues Apr 08 26 – 20 10.40 TRUE
4 Brumbies vs. Reds Apr 08 43 – 10 16.80 TRUE
5 Sharks vs. Jaguares Apr 08 18 – 13 6.70 TRUE
6 Stormers vs. Chiefs Apr 08 34 – 26 -2.70 FALSE
7 Force vs. Kings Apr 09 46 – 41 13.50 TRUE


Predictions for Round 8

Here are the predictions for Round 8. The prediction is my estimated expected points difference with a positive margin being a win to the home team, and a negative margin a win to the away team.

Game Date Winner Prediction
1 Crusaders vs. Sunwolves Apr 14 Crusaders 32.00
2 Reds vs. Kings Apr 15 Reds 10.70
3 Blues vs. Hurricanes Apr 15 Hurricanes -11.40
4 Rebels vs. Brumbies Apr 15 Brumbies -13.90
5 Cheetahs vs. Chiefs Apr 15 Chiefs -16.20
6 Stormers vs. Lions Apr 15 Stormers 1.10
7 Bulls vs. Jaguares Apr 15 Bulls 2.30


NRL Predictions for Round 7

Team Ratings for Round 7

The basic method is described on my Department home page.

Here are the team ratings prior to this week’s games, along with the ratings at the start of the season.

Current Rating Rating at Season Start Difference
Raiders 10.11 9.94 0.20
Storm 8.06 8.49 -0.40
Broncos 6.26 4.36 1.90
Sharks 6.05 5.84 0.20
Panthers 3.62 6.08 -2.50
Cowboys 2.98 6.90 -3.90
Dragons 0.52 -7.74 8.30
Roosters -0.12 -1.17 1.00
Sea Eagles -1.49 -2.98 1.50
Eels -1.82 -0.81 -1.00
Rabbitohs -2.39 -1.82 -0.60
Bulldogs -2.67 -1.34 -1.30
Titans -4.83 -0.98 -3.90
Wests Tigers -5.99 -3.89 -2.10
Warriors -6.28 -6.02 -0.30
Knights -14.05 -16.94 2.90


Performance So Far

So far there have been 48 matches played, 25 of which were correctly predicted, a success rate of 52.1%.
Here are the predictions for last week’s games.

Game Date Score Prediction Correct
1 Broncos vs. Roosters Apr 06 32 – 8 7.30 TRUE
2 Knights vs. Bulldogs Apr 07 12 – 22 -7.40 TRUE
3 Panthers vs. Rabbitohs Apr 07 20 – 21 11.50 FALSE
4 Sea Eagles vs. Dragons Apr 08 10 – 35 6.20 FALSE
5 Titans vs. Raiders Apr 08 16 – 42 -8.70 TRUE
6 Cowboys vs. Wests Tigers Apr 08 16 – 26 16.50 FALSE
7 Warriors vs. Eels Apr 09 22 – 10 -2.80 FALSE
8 Storm vs. Sharks Apr 09 2 – 11 8.20 FALSE


Predictions for Round 7

Here are the predictions for Round 7. The prediction is my estimated expected points difference with a positive margin being a win to the home team, and a negative margin a win to the away team.

Game Date Winner Prediction
1 Bulldogs vs. Rabbitohs Apr 14 Bulldogs 3.20
2 Knights vs. Roosters Apr 14 Roosters -10.40
3 Broncos vs. Titans Apr 14 Broncos 14.60
4 Sea Eagles vs. Storm Apr 15 Storm -6.10
5 Raiders vs. Warriors Apr 15 Raiders 20.40
6 Dragons vs. Cowboys Apr 15 Dragons 1.00
7 Panthers vs. Sharks Apr 16 Panthers 1.10
8 Eels vs. Wests Tigers Apr 17 Eels 7.70