Cyclone uncertainty
Cyclone Cook ended up a bit east of where it was expected, and so Auckland had very little damage. That’s obviously a good thing for Auckland, but it would be even better if we’d had no actual cyclone and no forecast cyclone. Whether the precautions Auckland took were necessary (at the time) or a waste depends on how much uncertainty there was at the time, which is something we didn’t get a good idea of.
In the southeastern USA, where they get a lot of tropical storms, there’s more need for forecasters to communicate uncertainty and also more opportunity for the public to get to understand what the forecasters mean. There’s scientific research into getting better forecasts, but also into explaining them better. Here’s a good article at Scientific American
Here’s an example (research page):
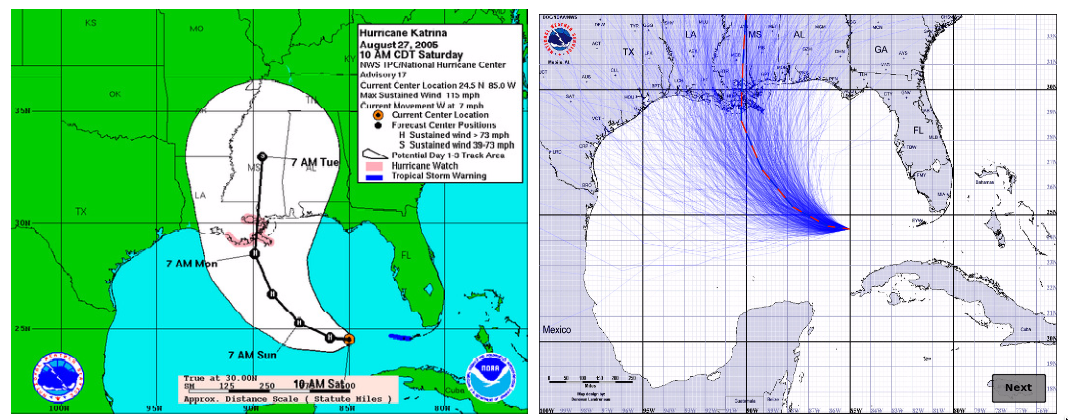
On the left is the ‘cone’ graphic currently used by the National Hurricane Center. The idea is that the current forecast puts the eye of the hurricane on the black line, but it could reasonably be anywhere in the cone. It’s like the little blue GPS uncertainty circles for maps on your phone — except that it also could give the impression of the storm growing in size. On the right is a new proposal, where the blue lines show a random sample of possible hurricane tracks taking the uncertainty into account — but not giving any idea of the area of damage around each track.
There’s also uncertainty in the predicted rainfall. NIWA gave us maps of the current best-guess predictions, but no idea of uncertainty. The US National Weather Service has a new experimental idea: instead of giving maps of the best-guess amount, give maps of the lower and upper estimates, titled: “Expect at least this much” and “Potential for this much”.
In New Zealand, uncertainty in rainfall amount would be a good place to start, since it’s relevant a lot more often than cyclone tracks.
Update: I’m told that the Met Service do produce cyclone track forecasts with uncertainty, so we need to get better at using them. It’s still likely more useful to experiment with rainfall uncertainty displays, since we get heavy rain a lot more often than cyclones.
Thomas Lumley (@tslumley) is Professor of Biostatistics at the University of Auckland. His research interests include semiparametric models, survey sampling, statistical computing, foundations of statistics, and whatever methodological problems his medical collaborators come up with. He also blogs at Biased and Inefficient See all posts by Thomas Lumley »
Their predictions of rainfall seemed to be way out, even for areas that were closest to the actual track.
back in 2009, Niwas touted their computer at Greta Pt as the fastest weather prediction computer in Southern hemisphere. Yet Metservice say their prediction maps come from the UK.
I use their rain forecast charts often but it seems to be stuck on a ‘once a day’ update cycle only.
In tricky situations metvuw.com can give a better result. I would love to compare their results over the last 36 hours
9 years ago
Better than comparing models and picking the best would be to combine the models and get more idea of uncertainty — as in the calibrated probability forecasts from the University of Washington.
9 years ago
This came up with Hurricane Sandy when the US predictions of track were wrong ( fizzle out to sea) while the Europeans were closer to reality
http://www.scientificamerican.com/article/are-europeans-better-than-americans-at-forecasting-storms1/
” Then, using simulations, the data points are packed onto a grid, essentially creating a three-dimensional description of the atmosphere. “The [Europeans] are better at this because their simulation system is better, and they use more data than we do,”
9 years ago