A century of immigration
Given the discussions of immigration in the past weeks, I decided to look for some historical data. Stats NZ has a report “A Century of Censuses”, with a page on ‘proportion of population born overseas.” Here’s the graph
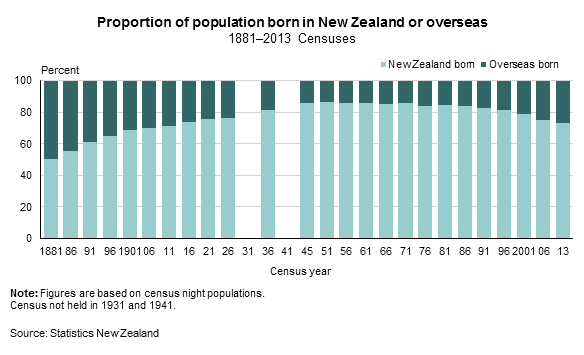
The proportion of immigrants has never been very low, but it fell from about 1 in 2 in the late 19th century to about 1 in 6 in the middle of the 2oth century, and has risen to about 1 in 4 now. The increase has been going on for the entire lifetime of any NZ member of Parliament; the oldest was born roughly at Peak Kiwi in the mid-1940s.
Seeing that immigrants have been a large minority of New Zealand for over a century doesn’t necessarily imply anything about modern immigration policy — Hume’s Guillotine, “no ought deducible from is,” cuts that off. But I still think some people would find it surprising.
Thomas Lumley (@tslumley) is Professor of Biostatistics at the University of Auckland. His research interests include semiparametric models, survey sampling, statistical computing, foundations of statistics, and whatever methodological problems his medical collaborators come up with. He also blogs at Biased and Inefficient See all posts by Thomas Lumley »
The interesting thing is that the NZ birth rate starts picking up from 1943 (See the bottom of this webpage for the graphs
http://rpubs.com/thoughtfulbloke/canusabr ) which is when the Americans were stationed here before heading into the Pacific – peaking at 45,000 soldiers. (While 140,000 NZers were serving in the war, presumably not all overseas.)
So I don’t think “proportion born in NZ” reflects the cosmopolitan make-up of the births at that time.
Although, she’s no longer a politician, Tariana Turia (born 1944 – at the time of “peak-kiwi”) has an American father.
7 years ago
Australia and Canada have similar levels of “foreign born”, as I understand it. As you say, “peak kiwi” and cultural homogeneity was the 1940s and the 1950s. The big difference now is the mix. While traditional source countries are still there, there are many more migrants from non-traditional source countries outside the anglophone world (Pacific, Asia for example). This, plus a depleted welfare state and laissez-faire policies in housing, make it different.
7 years ago
I wonder what this looks like if you only include the Auckland population
7 years ago
I don’t think the data’s published at that level, so it might take looking through reports on squashed trees to work it out.
7 years ago
Auckland is currently about 40% foreign born. I don’t know what it would have been historically, but possible always higher migrant population than the rest of the country.
Incidentally, I think this measure a better indicator of migrant impact than throwing international students and working holiday visas into the same pot.
Also, the big thing that has changed, probably temporarily, to put the pressure on is that far fewer NZers are leaving and more are returning than recent history shows, so this alters the “cultural significance” (i.e. not foreign born), if it is does not alter the demographic facts of more people needing services (particularly in Auckland, and particularly in housing).
7 years ago
Interestingly, it’s in the last three years that the numbers of migrants has increased reasonably dramatically, so would be interesting to see the data with that included.
7 years ago
Good point. We’ll need to wait for the next census for that. Some of the acceleration is from fewer people born in NZ leaving and more coming back, so that part of it won’t affect the overall figures, but the rest (including student visas) will show up.
7 years ago