Posts from March 2018 (19)

March 28, 2018

Cycling for work or play

Auckland Transport publish data from cycle counters on various bike paths. They’re most interested in trends over time (increasing) and perhaps in seasonal variation (more in summer).

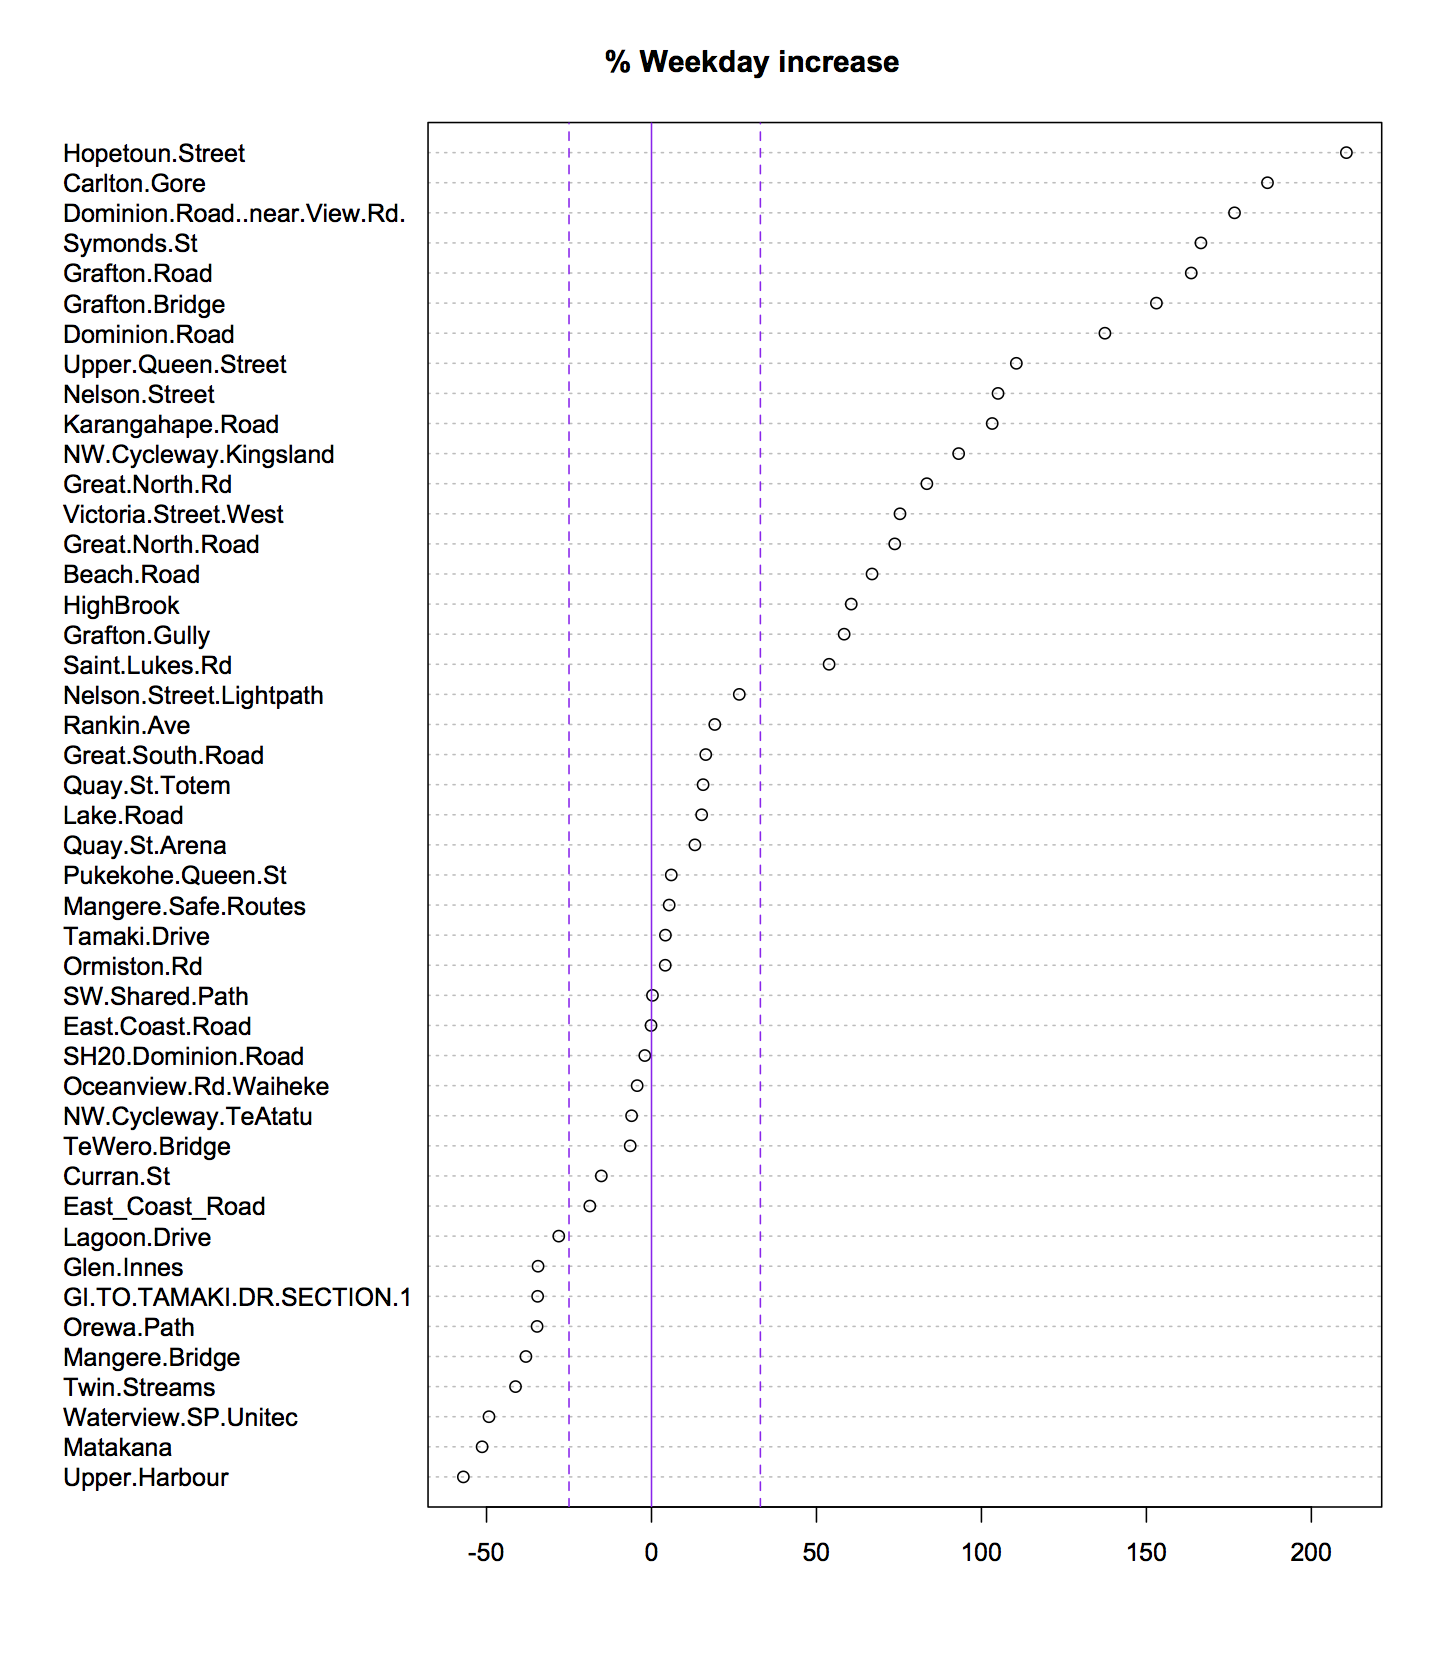
Here’s a look at weekday vs weekend counts using data from the start of 2016 to now (click to embiggen).

There are some paths that are clearly used primarily by commuters, with more than twice the average traffic on a weekday vs weekend. There are also some that are mostly used at the weekend, such as Matakana, Upper Harbour, and Mangere Bridge.  And some, like the Lightpath, that get used all the time.

Note: while it’s great that Auckland Transport publishes these data, the data would be easier to reuse if the names they used for each counter were consistent over time (eg: “Tamaki Dr” vs “Tamaki Drive”, or “Nelson Street Lightpath Counter Cyclists” vs “Nelson Street Lightpath Cyclists”)


March 27, 2018

Super 15 Predictions for Round 7

Team Ratings for Round 7

The basic method is described on my Department home page.
Here are the team ratings prior to this week’s games, along with the ratings at the start of the season.

Current Rating Rating at Season Start Difference
Hurricanes 16.51 16.18 0.30
Crusaders 14.63 15.23 -0.60
Highlanders 10.27 10.29 -0.00
Chiefs 10.13 9.29 0.80
Lions 8.45 13.81 -5.40
Stormers 1.02 1.48 -0.50
Blues 0.50 -0.24 0.70
Brumbies -1.36 1.75 -3.10
Sharks -1.49 1.02 -2.50
Waratahs -2.55 -3.92 1.40
Bulls -3.74 -4.79 1.10
Jaguares -4.16 -4.64 0.50
Reds -7.95 -9.47 1.50
Rebels -8.64 -14.96 6.30
Sunwolves -19.04 -18.42 -0.60


Performance So Far

So far there have been 36 matches played, 24 of which were correctly predicted, a success rate of 66.7%.
Here are the predictions for last week’s games.

Game Date Score Prediction Correct
1 Crusaders vs. Bulls Mar 23 33 – 14 22.80 TRUE
2 Rebels vs. Sharks Mar 23 46 – 14 -7.90 FALSE
3 Sunwolves vs. Chiefs Mar 24 10 – 61 -21.70 TRUE
4 Hurricanes vs. Highlanders Mar 24 29 – 12 8.80 TRUE
5 Stormers vs. Reds Mar 24 25 – 19 13.90 TRUE
6 Jaguares vs. Lions Mar 24 49 – 35 -11.70 FALSE


Predictions for Round 7

Here are the predictions for Round 7. The prediction is my estimated expected points difference with a positive margin being a win to the home team, and a negative margin a win to the away team.

Game Date Winner Prediction
1 Chiefs vs. Highlanders Mar 30 Chiefs 3.40
2 Rebels vs. Hurricanes Mar 30 Hurricanes -21.10
3 Blues vs. Sharks Mar 31 Blues 6.00
4 Brumbies vs. Waratahs Mar 31 Brumbies 4.70
5 Bulls vs. Stormers Mar 31 Stormers -1.30
6 Lions vs. Crusaders Apr 01 Crusaders -2.20


NRL Predictions for Round 4

Team Ratings for Round 4

The basic method is described on my Department home page.
Here are the team ratings prior to this week’s games, along with the ratings at the start of the season.

Current Rating Rating at Season Start Difference
Storm 15.10 16.73 -1.60
Dragons 4.51 -0.45 5.00
Broncos 3.17 4.78 -1.60
Cowboys 2.98 2.97 0.00
Panthers 2.73 2.64 0.10
Roosters 2.10 0.13 2.00
Sharks 2.08 2.20 -0.10
Raiders 0.73 3.50 -2.80
Sea Eagles 0.02 -1.07 1.10
Wests Tigers -1.68 -3.63 2.00
Rabbitohs -2.47 -3.90 1.40
Bulldogs -3.84 -3.43 -0.40
Eels -3.87 1.51 -5.40
Warriors -4.39 -6.97 2.60
Knights -8.30 -8.43 0.10
Titans -11.17 -8.91 -2.30


Performance So Far

So far there have been 24 matches played, 13 of which were correctly predicted, a success rate of 54.2%.
Here are the predictions for last week’s games.

Game Date Score Prediction Correct
1 Storm vs. Cowboys Mar 22 30 – 14 15.00 TRUE
2 Bulldogs vs. Panthers Mar 23 20 – 18 -4.50 FALSE
3 Wests Tigers vs. Broncos Mar 23 7 – 9 -1.80 TRUE
4 Raiders vs. Warriors Mar 24 19 – 20 11.40 FALSE
5 Rabbitohs vs. Sea Eagles Mar 24 34 – 6 -4.00 FALSE
6 Eels vs. Sharks Mar 24 4 – 14 -1.80 TRUE
7 Titans vs. Dragons Mar 25 8 – 54 -7.30 TRUE
8 Roosters vs. Knights Mar 25 38 – 8 10.70 TRUE


Predictions for Round 4

Here are the predictions for Round 4. The prediction is my estimated expected points difference with a positive margin being a win to the home team, and a negative margin a win to the away team.

Game Date Winner Prediction
1 Cowboys vs. Panthers Mar 29 Cowboys 3.20
2 Rabbitohs vs. Bulldogs Mar 30 Rabbitohs 4.40
3 Sharks vs. Storm Mar 30 Storm -10.00
4 Roosters vs. Warriors Mar 31 Roosters 11.00
5 Sea Eagles vs. Raiders Mar 31 Sea Eagles 2.30
6 Dragons vs. Knights Apr 01 Dragons 15.80
7 Broncos vs. Titans Apr 01 Broncos 17.30
8 Wests Tigers vs. Eels Apr 02 Wests Tigers 5.20


March 26, 2018

Accurate graphical rhetoric

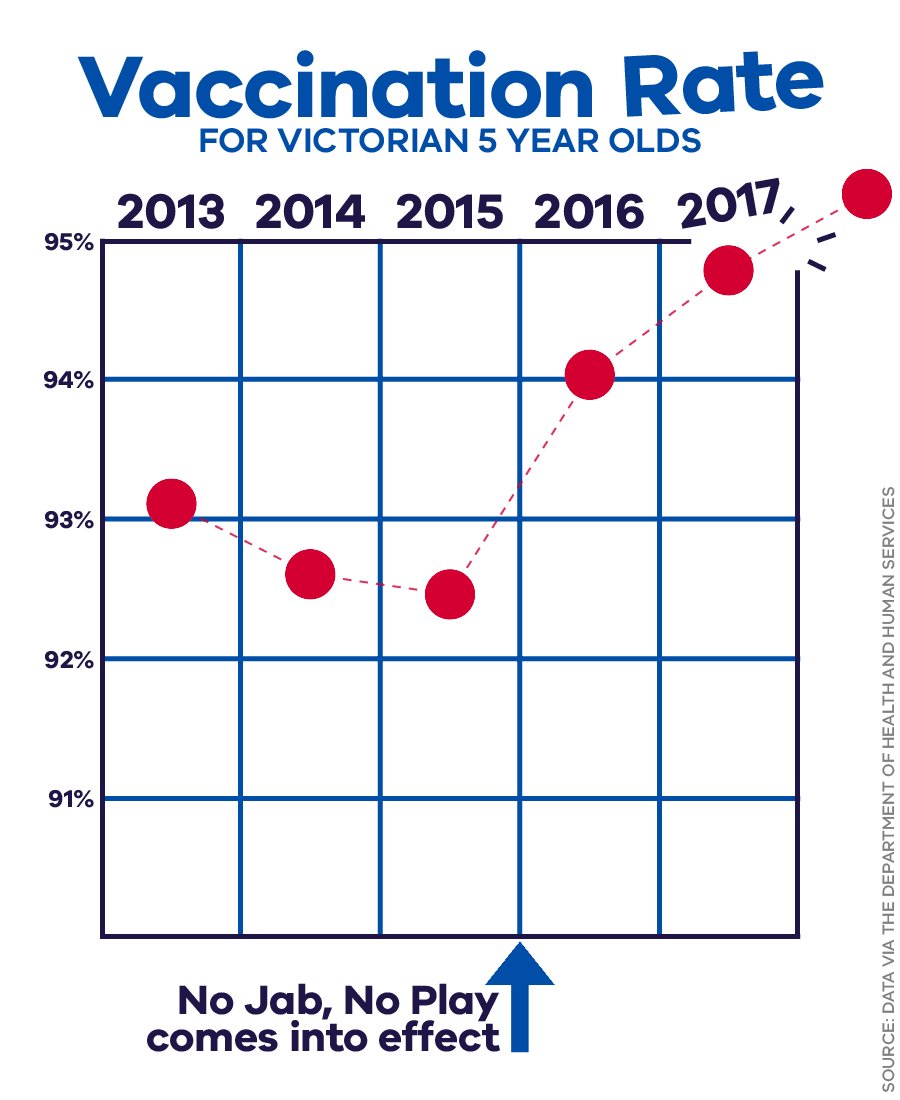
This graph comes from the Twitter account of Jill Hennessy, Victoria’s Minister for Health.  It’s obviously intended to make a particular point — and one that’s politically supportive to her.  However, it’s actually a pretty good graph.

The baseline isn’t zero, but this is clearly an example where a zero baseline would be silly: zero is not a relevant value of the vaccination rate.  The 95% top line is also not arbitrary: it’s the government target for vaccination, chosen because it’s thought to be high enough for herd immunity even to measles.  Having the line break out of the box is done without distorting the numerical values.   I might want some earlier data than 2013 to see the trends under the previous government, but that’s not a terrible omission.

The causal attribution of the increase to the “No Jab No Play” laws — restricting kindergarten, preschool, and daycare attendance for kids who are missing vaccinations — is obviously less solid, but it’s not implausible.  And there are some regions of Victoria where rates are still low. And there’s obviously room to argue about whether the laws denying benefits and restricting preschool/kindergarten/daycare enrolment are worth it even if they were responsible. But the graph itself, unusually for something from a minister, isn’t bad.

The data speak for themselves?

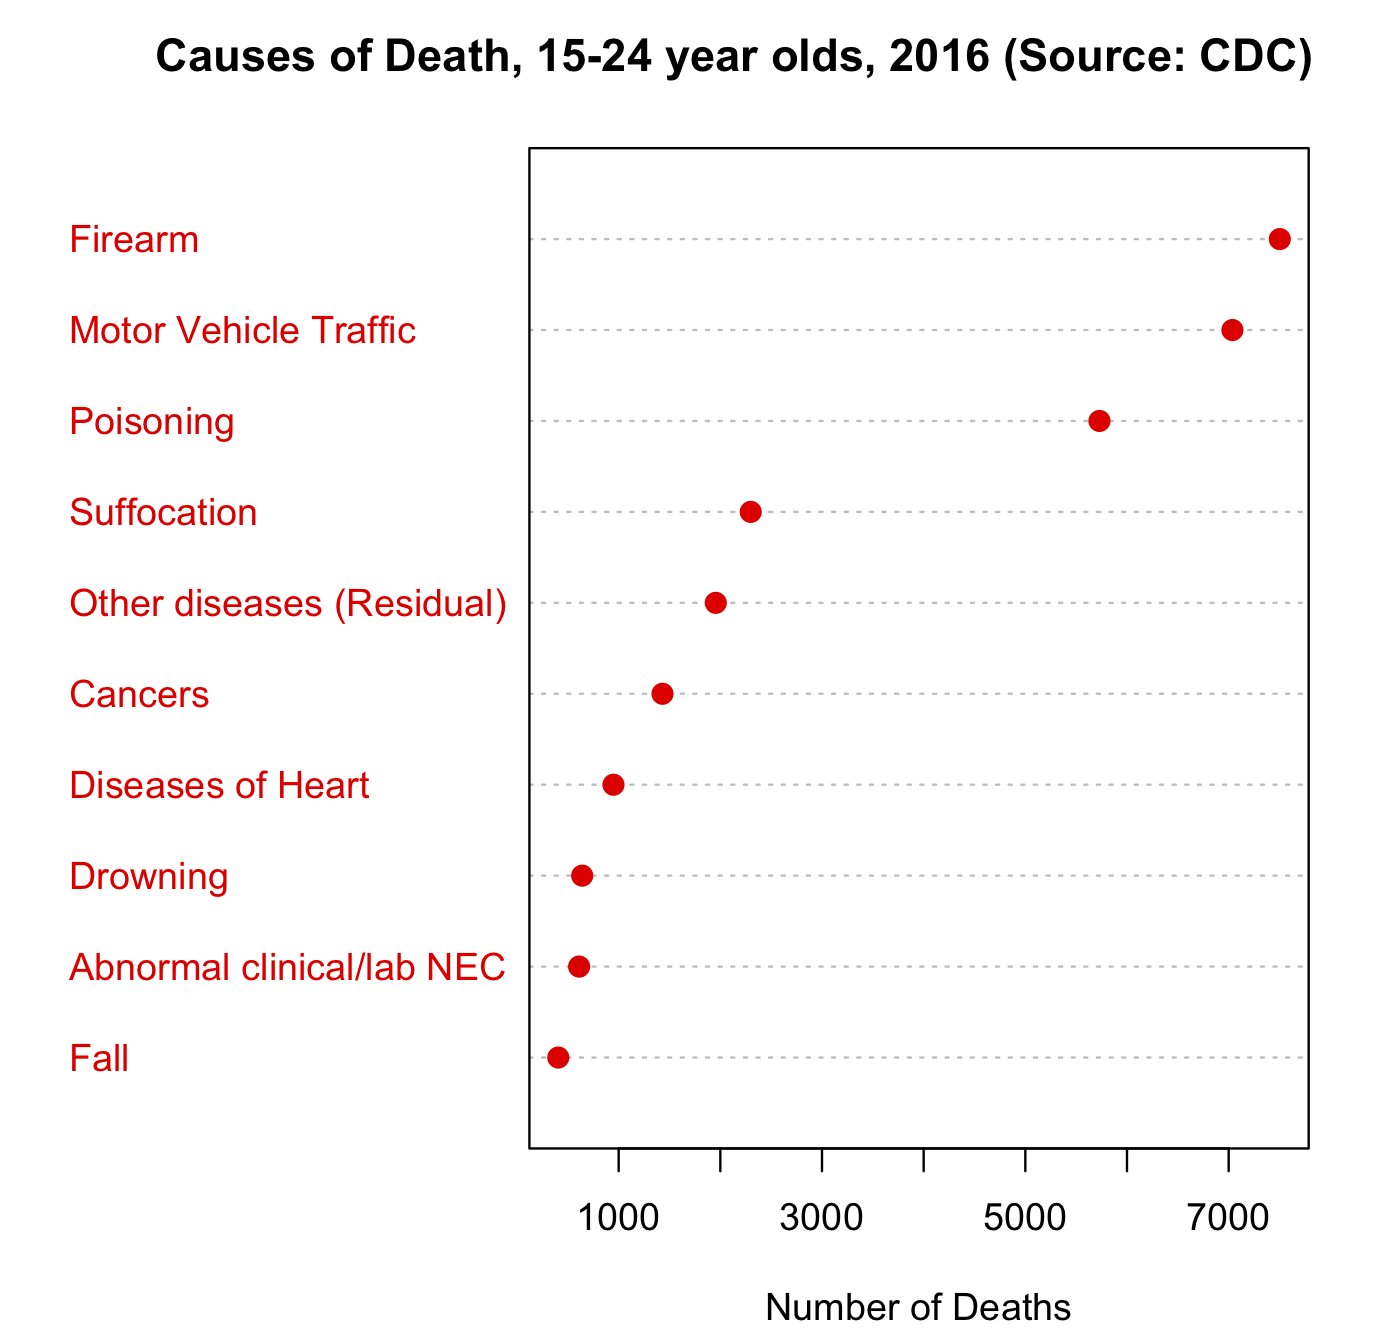
This graph was on Twitter this morning. There’s nothing wrong with the graph: good data, clear presentation, but it does provide a nice illustration of the difficulties in official statistics — you have to decide what categories to use, and it makes a difference.

The second leading cause, motor vehicles, is straightforward enough.  The first, firearms, is more complicated. A majority of the firearm deaths are suicides, and it’s controversial whether firearm access increases the suicide rate or just affects the method.  Poisoning is also complicated: you might well want to treat both suicide and accidental recreational-drug overdose separately. And so on.

Sometimes you want to break down the data by intent, sometimes by physical cause, sometimes by medical type of injury or damage. You can’t define the ‘correct’ answer in the absence of a question.

Ihaka Lecture Series 2018 – collected here for your viewing pleasure

The second annual edition of the Ihaka Lecture Series has just ended, and we are, once again, delighted with the turnout and engagement, in person and online. Our final speaker was Alberto Cairo, right, Knight Chair in Visual Journalism at the University of Miami, whose lecture on the dubious uses of data was thought-provoking and a bit worrying.

If you want to see how Trump supporters deluded themselves and misled others with graphics, it’s all laid bare here in Alberto’s lecture. And that this brand of Trumpery is not the only example of statistics willfully used to mislead – Alberto delivers a few other eye-openers. And some laughs, as well – he is a very entertaining and engaging speaker. By the way, it’s not all bad news – there is much useful and thoughtful work being done, and Alberto shows what that is and where.

Alberto’s lecture is accessible to all. He uses non-technical language, as and Alberto says, he’s not a statistician. So if you are teaching secondary-school statistics (or citizenship or social studies … ) this would be a really good resource for your students.

Also, Alberto was yesterday interviewed by Colin Peacock, the long-time host of Radio New Zealand’s Mediawatch, and it’s recommended listening. The pic Mediawatch ran of Alberto on its webpage was so nice, we stole it. Nice image, RNZ’s Claire Eastham-Farrelly!

Of course, we also had two other incomparable speakers: our own Associate Professor Paul Murrell, one of the movers and shakers behind R, on the BrailleR package, which generates text descriptions of R plots (watch here) and Monash Professor Dianne Cook, who described some simple tools for helping to decide if patterns you think you are seeing in the data are really there (watch here).

And … in breaking news, the theme of next year’s Ihaka Lecture Series is … machine learning! Speakers will be announced at a later date.

+ Useful link: The 2017 Ihaka Lecture Series.

March 20, 2018

Super 15 Predictions for Round 6

Team Ratings for Round 6

The basic method is described on my Department home page.

Here are the team ratings prior to this week’s games, along with the ratings at the start of the season.

Current Rating Rating at Season Start Difference
Hurricanes 16.02 16.18 -0.20
Crusaders 14.86 15.23 -0.40
Highlanders 10.76 10.29 0.50
Lions 9.99 13.81 -3.80
Chiefs 8.37 9.29 -0.90
Stormers 1.50 1.48 0.00
Sharks 0.91 1.02 -0.10
Blues 0.50 -0.24 0.70
Brumbies -1.36 1.75 -3.10
Waratahs -2.55 -3.92 1.40
Bulls -3.98 -4.79 0.80
Jaguares -5.70 -4.64 -1.10
Reds -8.43 -9.47 1.00
Rebels -11.03 -14.96 3.90
Sunwolves -17.28 -18.42 1.10


Performance So Far

So far there have been 30 matches played, 20 of which were correctly predicted, a success rate of 66.7%.
Here are the predictions for last week’s games.

Game Date Score Prediction Correct
1 Chiefs vs. Bulls Mar 16 41 – 28 16.80 TRUE
2 Highlanders vs. Crusaders Mar 17 25 – 17 -1.80 FALSE
3 Brumbies vs. Sharks Mar 17 24 – 17 1.00 TRUE
4 Stormers vs. Blues Mar 17 37 – 20 3.40 TRUE
5 Lions vs. Sunwolves Mar 17 40 – 38 35.30 TRUE
6 Jaguares vs. Reds Mar 17 7 – 18 9.10 FALSE
7 Waratahs vs. Rebels Mar 18 51 – 27 10.30 TRUE


Predictions for Round 6

Here are the predictions for Round 6. The prediction is my estimated expected points difference with a positive margin being a win to the home team, and a negative margin a win to the away team.


Game Date Winner Prediction
1 Crusaders vs. Bulls Mar 23 Crusaders 22.80
2 Rebels vs. Sharks Mar 23 Sharks -7.90
3 Sunwolves vs. Chiefs Mar 24 Chiefs -21.70
4 Hurricanes vs. Highlanders Mar 24 Hurricanes 8.80
5 Stormers vs. Reds Mar 24 Stormers 13.90
6 Jaguares vs. Lions Mar 24 Lions -11.70


NRL Predictions for Round

Team Ratings for Round 3

The basic method is described on my Department home page.

Here are the team ratings prior to this week’s games, along with the ratings at the start of the season.

Current Rating Rating at Season Start Difference
Storm 15.03 16.73 -1.70
Panthers 3.19 2.64 0.60
Broncos 3.16 4.78 -1.60
Cowboys 3.05 2.97 0.10
Sea Eagles 2.26 -1.07 3.30
Dragons 1.80 -0.45 2.20
Raiders 1.60 3.50 -1.90
Sharks 1.50 2.20 -0.70
Roosters 0.75 0.13 0.60
Wests Tigers -1.67 -3.63 2.00
Eels -3.30 1.51 -4.80
Bulldogs -4.30 -3.43 -0.90
Rabbitohs -4.71 -3.90 -0.80
Warriors -5.25 -6.97 1.70
Knights -6.95 -8.43 1.50
Titans -8.46 -8.91 0.50


Performance So Far

So far there have been 16 matches played, 8 of which were correctly predicted, a success rate of 50%.
Here are the predictions for last week’s games.

Game Date Score Prediction Correct
1 Sharks vs. Dragons Mar 15 16 – 20 3.80 FALSE
2 Roosters vs. Bulldogs Mar 16 30 – 12 6.40 TRUE
3 Broncos vs. Cowboys Mar 16 24 – 20 3.00 TRUE
4 Warriors vs. Titans Mar 17 20 – 8 7.00 TRUE
5 Panthers vs. Rabbitohs Mar 17 18 – 14 12.00 TRUE
6 Storm vs. Wests Tigers Mar 17 8 – 10 23.20 FALSE
7 Sea Eagles vs. Eels Mar 18 54 – 0 1.20 TRUE
8 Raiders vs. Knights Mar 18 28 – 30 13.80 FALSE


Predictions for Round 3

Here are the predictions for Round 3. The prediction is my estimated expected points difference with a positive margin being a win to the home team, and a negative margin a win to the away team.

Game Date Winner Prediction
1 Storm vs. Cowboys Mar 22 Storm 15.00
2 Bulldogs vs. Panthers Mar 23 Panthers -4.50
3 Wests Tigers vs. Broncos Mar 23 Broncos -1.80
4 Raiders vs. Warriors Mar 24 Raiders 11.40
5 Rabbitohs vs. Sea Eagles Mar 24 Sea Eagles -4.00
6 Eels vs. Sharks Mar 24 Sharks -1.80
7 Titans vs. Dragons Mar 25 Dragons -7.30
8 Roosters vs. Knights Mar 25 Roosters 10.70


March 17, 2018

Briefly

March 16, 2018

Low-flying rocks

This is starting to look like a series. The Herald today has Warning: Doomsday asteroid taller than Empire State building cannot be stopped by Nasa. They go on to say

The consequences would be “dire” experts have warned, and the asteroid has sparked fears that it could even wipe out life for good.

Stuff has the less-exciting headline Nasa draws up plans for huge eight-ton spacecraft to blow up doomsday asteroid. You might be able to guess which one is more accurate.

If you follow the link from the Herald to the Daily Mail, and then from the Daily Mail to the scientific research paper, and then get past the paywall, you find the research is about the best ways to handle an asteroid like this one if it turns out to be a threat. As the Stuff story says, the scientists think they could manage a deflection given enough notice; with less warning than that they might need to blow it up with a big nuke.

So, how much warning do we have? The Herald says

Based on observational data, Bennu has a 1 in 2,700-chance of striking Earth on Sept. 25, 2135.

That’s quite a long time in the future — if scientists think they’ve got a good chance of deflecting it even with today’s technology, we should be ok even without Bruce Willis.

That’s if we believe the numbers in the story. Let’s check them. The research paper points to a lovely website from NASA that lists all the object we know about that could get scarily close to Earth at some point in the future.  Here’s their entry for Doomsday Asteroid 101955 Bennu.

Bennu has a cumulative impact probability of 3.7×10⁻⁴, ie, 1/2,700.  That’s added up over the entire foreseeable future. There are 78 potential impact dates listed. The first is 25th September 2175, with a probability of 4.1×10⁻⁵, or about 1/25,000.  The remainder of the 1/2700 probability is spread over the following 25 years.  So, the date is wrong, and the probability is misleading. Since it looks like the Daily Mail got the numbers from Buzzfeed, that’s a bit disappointing.

The NASA site also lists 101955 Bennu as -1.71 on the “Palermo scale.” The Palermo scale compares the risk of being hit by a specific asteroid over a period of time to the expected risk of being hit by all the other asteroids of the same size that we don’t know about yet. Bennu’s -1.71 means the risk from Bennu is 10-1.71 times lower than the background risk — about 50 times lower. Dealling with Bennu would lower our risk over the next couple of centuries for asteroids of that size by a few percent. It’s worth doing — but mostly as a test of the technology.

Also, it would be interesting to know who is actually afraid the asteroid “could wipe out life for good”. It’s presumably not the “experts” from earlier in the sentence: the impact is estimated as having the energy of a 1.15 gigaton explosion.  That’s not something you want in your school zone, but it’s tiny compared to, say, the Taupo eruption roughly 2000 years ago. It’s about of the order of magnitude of the Tarawera explosion in 1886.  An impact in the worst possible place — maybe on top of Shanghai —  could kill a lot of people even with the best evacuation efforts but it wouldn’t wipe out industrial civilisation, let alone all life.


(hat tip: Mark Hanna)