Posts from June 2018 (16)

June 28, 2018

Progressive or regressive fuel taxes

From the Herald

And in a startling revelation, the ministers claim that the wealthier a household is, the more it is likely to pay for petrol. They say the wealthiest 10 per cent of households will pay $7.71 per week more for petrol. Those with the lowest incomes will pay $3.64 a week more.

That’s good to see. And it does contradict the impressions given by some of the opponents of the fuel tax. But it doesn’t address (or even allude to) more detailed criticisms of the tax.

Wealthy households, on average, spend more money than poor households.  They spend more on food. They spend more on entertainment. They spend more on cars.  They use public transit more. And they drive more.  So, on average, they pay more GST, and they pay more fuel tax. That’s not a startling revelation. Even in the US, higher-income households (on average) spend more money on petrol.

In the other direction, any user charge is going to be a lower proportion of income for wealthy than poor households. The regional fuel tax is no exception: according to the statistics in the Herald story, the average charge is only about twice as high for the top income decile as for the bottom. The ratio of incomes is much larger than two. Again, that’s not a startling revelation.

For questions where the answer isn’t obvious, we need more data.

First, we’d like to know the distribution of costs, not just the average.  For example, the lowest income bands will contain more people who don’t have cars (who are paying quite a bit less than the average) and, by arithmetic,  will also contain some people paying quite a bit more than the average.

Second, if you think of the fuel tax as being a sort of road user charge or a surrogate for a congestion charge, we’d want the amount paid per kilometre driven to be roughly constant. It would be undesirable for low-income household to pay more per kilometre than high-income households. (On the other hand, if you think of it as a carbon charge, it makes sense for it to be based on fuel amount but doesn’t make sense for it to be higher in Auckland.)

Answering these questions takes a bit more analysis. So, I’m going to refer you to Sam Warburton, an economist formerly with the Department of Transport and now with NZIER the NZ Initiative.  Here’s his Twitter thread reacting to the story, and here’s his (PDF) submission to Parliament on the taxes.

Politics is about compromise, and it’s possible these fuel taxes are the best of the politically-feasible options, but they aren’t all unicorns and rainbows.

June 27, 2018

Who should have a home?

Yesterday, the Herald published this story

The headline wasn’t true.

Today, the headline is different, It’s not 3% – ASB analysis suggests up to a fifth of properties sold to non-citizens.

There’s a big difference.

It’s hard to get statistics on how many citizens there are in NZ vs other long-term residents.  The Census, for example, doesn’t ask — as Stats NZ explains here, that’s partly because it’s more complicated than you think, and partly because there’s no good reason to care. Citizen vs resident is rarely an important distinction. A non-citizen with a residence-class visa can’t run for Parliament, but they can vote, serve in the defence forces, play for the All Blacks, and, yes, buy a home.

Up to a fifth of home purchases does seem a lot, but in this case “up to a fifth” actually means:

the assumption was that the true figure was at the lower end of the 11 per cent to 21 per cent range “but there’s no way to know. …”


It’s not just the headline: the story is a bit misleading.

First, they’re leaving out an important mechanism whereby real estate is transferred from non-citizens to citizens. My house is currently owned by a non-citizen. Some time early next year (if I get around to requesting my US police report soon),  I hope it will be owned by a New Zealand citizen. And my citizenship change wouldn’t show up in the ASB analysis.

Second, the ASB range of 11-21% is for homes, not properties as the headline claimed. Both ASB and StatsNZ make this distinction carefully.

Third, the extent to which the ASB analysis and StatsNZ numbers differ has been exaggerated a bit.  Here’s the StatsNZ report, which ASB links to.  The StatsNZ numbers for home transfers:

  • 79 percent involved at least one NZ citizen
  • 9.9 percent involved only corporate entities
  • 8.0 percent involved at least one NZ-resident-visa holder (but no citizens)
  • 3.3 percent involved no NZ citizens or resident-visa holders (up from 2.9 percent in the December 2017 quarter).

If you add 8 and 3 you get 11. If you add 8 and 3 and 9.9 you get 21.

If you don’t separate residents from citizens the range is 3-13%.

And if you go along with the ASB report’s assumption that the true figure is at the lower end of the range, well, you’d get a much more boring headline.


June 26, 2018

Briefly

  • Bias detectives: the researchers striving to make algorithms fair” from Nature News.  Featuring Auckland (AUT) researcher Rhema Vaithianathan.
  • In the UK, the Ada Lovelace Institute is being established, looking at these and related issues.
  • There were a bunch of headlines in the UK saying that life expectancy was falling (and often attributing the fall to ‘austerity’ policies).  Our World In Data looks at the issue: what is actually happening is that expected increases in life expectancy had been scaled back slightly, and this was due mostly to changes in projections for the increase in life expectancy of one 15-year group of people (born 1923-1938).  Official statistics is complicated.
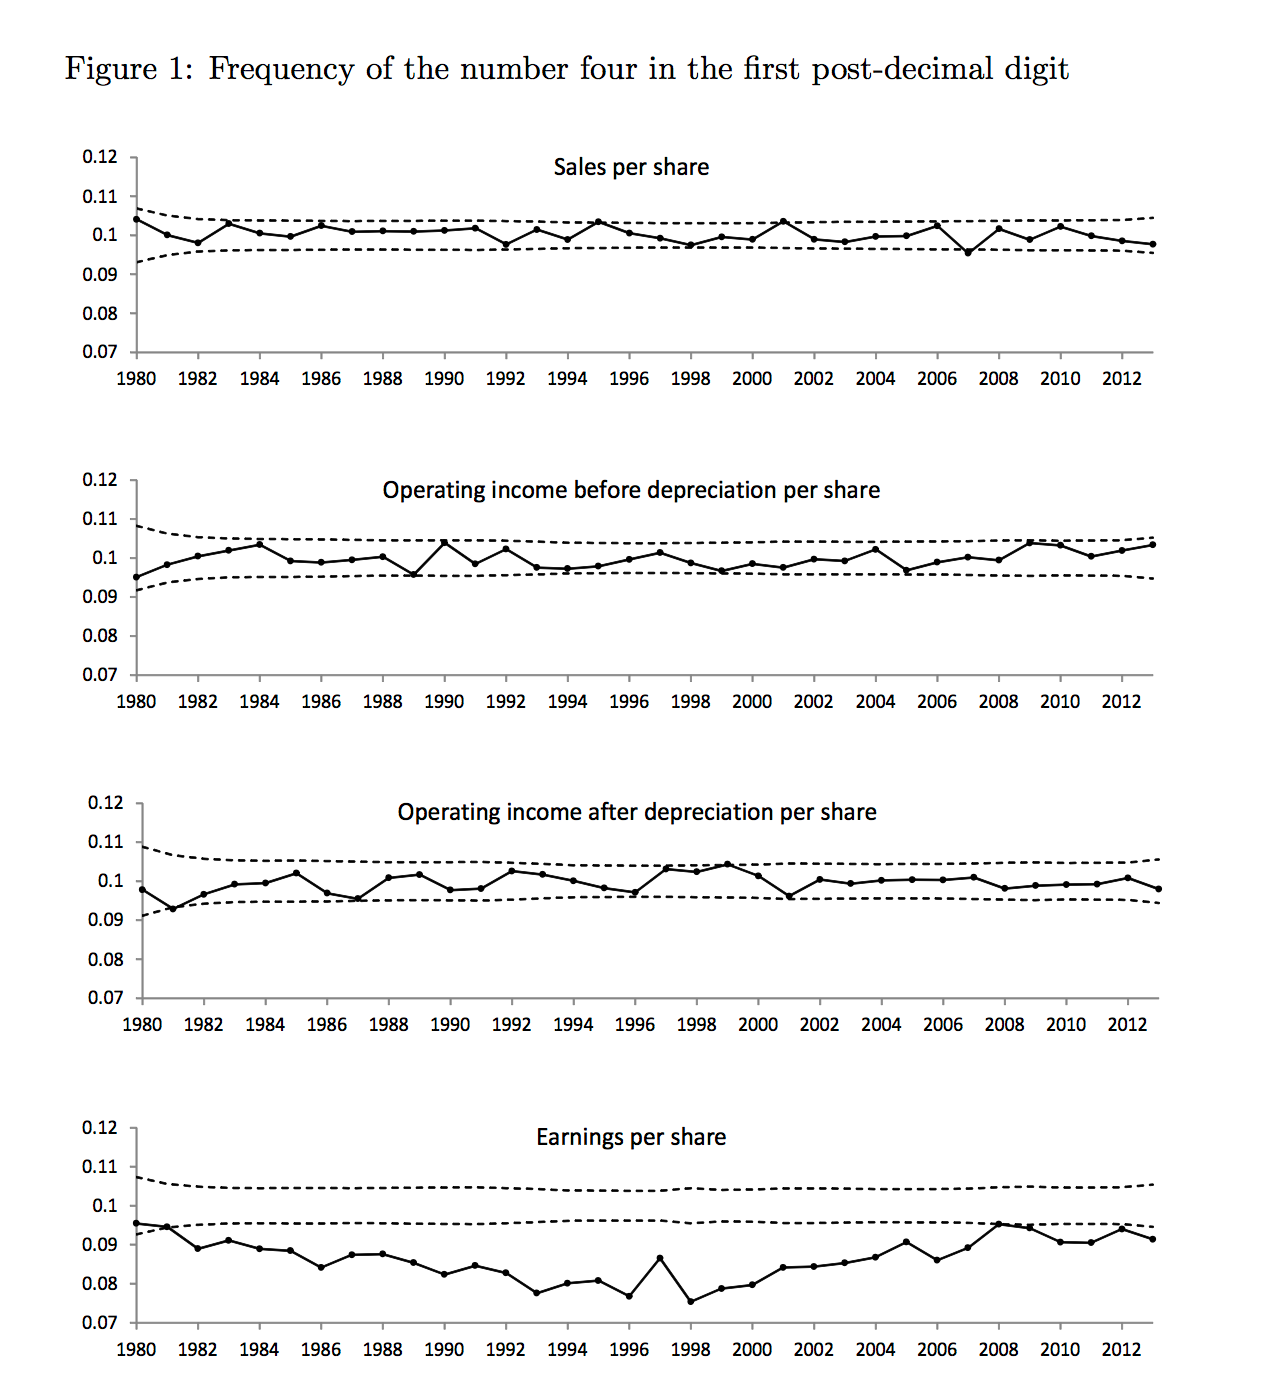
  • US researchers looked at the first digit after the decimal point in various numbers reported by companies listed on the stock exchange. For earnings per share, but not for other figures, there was a noticeable shortage of ‘4’s — about 8% rather than the expected 10% — suggesting that the numbers may have been manipulated a little so that this figure, which is published rounded to the nearest whole cent,  rounds up rather than rounding down.

    Interestingly, companies that didn’t post any .4s were more likely to “restate their financial statements, be named as defendants in SEC Accounting and Auditing Enforcement Releases, and be involved in class action securities fraud litigation” (via Matt Levine)
  • You may have seen in headlines that new research connects Alzheimer’s Disease to some very common viruses related to herpes. Derek Lowe writes about how this is better substantiated than a lot of previous alternative theories. But the take-home message is still that we don’t know what to do to treat or prevent AD.
June 21, 2018

Unnecessary work for the reader

From Newshub:

Overall opening day bookings for the Abel Tasman Track are already up from 551 last year to 811 this year.

Kiwi bookings have doubled, while international bookings are down by 20 percent. However, Ms Sage admits international visitors’ bookings could be masquerading as Kiwis. 

“There may be some people around the fringes, but it relies on honesty.”

For more idea of how much of an issue there might be with honesty of foreigners, it would be nice to compare the increase in local bookings and decrease in international bookings as actual numbers, not as percentages.  You can work this out (approximately) from the information given, but it involves high-school maths (solving a pair of linear equations), so perhaps DoC could just have been asked.

To add up to the numbers in the story, local bookings must have increased from about 308 to 616 and international bookings decreased from about 242 to 194. So, even if the entire decrease in international bookings was people pretending to be Kiwi, it would only explain a small fraction of the increase in local bookings.

June 20, 2018

Surprising lotto wins

The Herald has an annoyingly uncritical story about someone who claims to have a mathematical formula for winning the lottery, rather than just being lucky.

Much more interesting: BBC’s More or Less had a story about multiple lottery wins and how they might come about.

Briefly

June 19, 2018

NRL Predictions for Round 16

Team Ratings for Round 16

The basic method is described on my Department home page.
Here are the team ratings prior to this week’s games, along with the ratings at the start of the season.

Current Rating Rating at Season Start Difference
Storm 9.51 16.73 -7.20
Dragons 4.78 -0.45 5.20
Rabbitohs 4.39 -3.90 8.30
Panthers 3.72 2.64 1.10
Roosters 3.46 0.13 3.30
Raiders 2.66 3.50 -0.80
Sharks 2.46 2.20 0.30
Broncos 0.58 4.78 -4.20
Cowboys -1.09 2.97 -4.10
Warriors -1.31 -6.97 5.70
Wests Tigers -3.46 -3.63 0.20
Bulldogs -4.20 -3.43 -0.80
Sea Eagles -4.87 -1.07 -3.80
Titans -5.21 -8.91 3.70
Eels -6.28 1.51 -7.80
Knights -7.45 -8.43 1.00


Performance So Far

So far there have been 116 matches played, 68 of which were correctly predicted, a success rate of 58.6%.
Here are the predictions for last week’s games.

Game Date Score Prediction Correct
1 Eels vs. Rabbitohs Jun 14 24 – 42 -6.00 TRUE
2 Cowboys vs. Warriors Jun 15 16 – 23 6.60 FALSE
3 Roosters vs. Panthers Jun 15 32 – 6 -1.10 FALSE
4 Bulldogs vs. Titans Jun 16 10 – 32 8.20 FALSE
5 Dragons vs. Sea Eagles Jun 16 32 – 8 10.80 TRUE
6 Sharks vs. Broncos Jun 16 16 – 20 6.30 FALSE
7 Knights vs. Storm Jun 17 10 – 28 -13.30 TRUE
8 Wests Tigers vs. Raiders Jun 17 12 – 48 2.20 FALSE


Predictions for Round 16

Here are the predictions for Round 16. The prediction is my estimated expected points difference with a positive margin being a win to the home team, and a negative margin a win to the away team.

Game Date Winner Prediction
1 Dragons vs. Eels Jun 28 Dragons 14.10
2 Warriors vs. Sharks Jun 29 Warriors 0.70
3 Roosters vs. Storm Jun 29 Storm -3.10
4 Panthers vs. Sea Eagles Jun 30 Panthers 11.60
5 Knights vs. Bulldogs Jun 30 Bulldogs -0.20
6 Broncos vs. Raiders Jun 30 Broncos 0.90
7 Wests Tigers vs. Titans Jul 01 Wests Tigers 4.70
8 Rabbitohs vs. Cowboys Jul 01 Rabbitohs 8.50


June 14, 2018

AA study causes drug headlines

Journalists are often reluctant to attribute causes for individual events — the journalistic use of ‘after’ and ‘amid’ leads readers to conclusions in a much more deniable way — but less reluctant for groups.

Today, there’s an interesting range of descriptions of some research

HeraldAutomobile Association study finds drugs cause more fatal crashes than alcohol

StuffDrug-impaired drivers now involved in more fatal crashes than drink-drivers

Radio NZDrugged driving fatalities outnumber drink driving deaths

NZ Autocar: AA FINDS MARKED INCREASE IN DRUG DRIVING FATALITIES

None of these link to the actual study report, and when I first looked, the report was on the AA website or on Scoop, but it the results table is in the NZ Autocar story. (Scoop has a press release from 10:49am; it’s still not on the AA website, where the most recent media release is dated 21 May)

None of the headlines is supported all that well by the data.

The data are based on what’s recorded in the ‘Crash Analysis System’, and is based on blood alcohol above the legal level and on presence of illegal drugs or prescription drugs that might have impaired the driver.  It’s not based on actual impairment (which is obviously hard to measure after the crash). The Crash Analysis System is set up to record anything that might be a contributing cause, because if some factor doesn’t make it into the database there’s no way to go back and check it later. Back in 2015 when the data were public and I looked at them, the system averaged about 2 1/4 causes per crash.

We pretty much know that most crashes where the driver is not far above the legal blood alcohol limit are not caused by alcohol — that’s the whole point of setting the threshold where it is.  For some illegal drugs — notably, cannabis — there isn’t a good test for impairment in regular users.

The AA says that other countries are using roadside testing. They are, and that’s partly because some countries regard the false positives  — catching someone who has used illegal drugs but isn’t impaired at the time — as a feature, not a bug.  The combination of alcohol and cannabis does seem to be a real problem, and US expert Mark Kleiman has suggested a blood alcohol threshold of zero for people who use cannabis.

But on top of that, as the NZ Autocar story says

While the numbers suggest drug driving has suddenly skyrocketed, the AA believes the big jump is likely down to more thorough testing being done following crashes.

That’s also in the press release. But it’s not in the other stories.

NRL Predictions for Round 15

Team Ratings for Round 15

The basic method is described on my Department home page.
Here are the team ratings prior to this week’s games, along with the ratings at the start of the season.

Current Rating Rating at Season Start Difference
Storm 9.18 16.73 -7.60
Panthers 5.61 2.64 3.00
Dragons 3.86 -0.45 4.30
Rabbitohs 3.55 -3.90 7.40
Sharks 3.18 2.20 1.00
Roosters 1.56 0.13 1.40
Raiders -0.02 3.50 -3.50
Broncos -0.14 4.78 -4.90
Cowboys -0.14 2.97 -3.10
Wests Tigers -0.79 -3.63 2.80
Bulldogs -2.08 -3.43 1.30
Warriors -2.27 -6.97 4.70
Sea Eagles -3.94 -1.07 -2.90
Eels -5.44 1.51 -7.00
Knights -7.12 -8.43 1.30
Titans -7.33 -8.91 1.60


Performance So Far

So far there have been 108 matches played, 65 of which were correctly predicted, a success rate of 60.2%.
Here are the predictions for last week’s games.

Game Date Score Prediction Correct
1 Raiders vs. Panthers Jun 08 22 – 23 -2.90 TRUE
2 Titans vs. Rabbitohs Jun 08 16 – 18 -8.80 TRUE
3 Sea Eagles vs. Warriors Jun 09 14 – 34 6.50 FALSE
4 Knights vs. Roosters Jun 09 16 – 18 -6.30 TRUE
5 Eels vs. Cowboys Jun 09 20 – 14 -3.70 FALSE
6 Sharks vs. Wests Tigers Jun 10 24 – 16 6.80 TRUE
7 Storm vs. Broncos Jun 10 32 – 16 11.70 TRUE
8 Bulldogs vs. Dragons Jun 11 16 – 18 -3.10 TRUE


Predictions for Round 15

Here are the predictions for Round 15. The prediction is my estimated expected points difference with a positive margin being a win to the home team, and a negative margin a win to the away team.

Game Date Winner Prediction
1 Eels vs. Rabbitohs Jun 14 Rabbitohs -6.00
2 Cowboys vs. Warriors Jun 15 Cowboys 6.60
3 Roosters vs. Panthers Jun 15 Panthers -1.10
4 Bulldogs vs. Titans Jun 16 Bulldogs 8.20
5 Dragons vs. Sea Eagles Jun 16 Dragons 10.80
6 Sharks vs. Broncos Jun 16 Sharks 6.30
7 Knights vs. Storm Jun 17 Storm -13.30
8 Wests Tigers vs. Raiders Jun 17 Wests Tigers 2.20


June 13, 2018

Briefly