October 17, 2018
Briefly
- The Crime Machine: two podcast episodes (with transcripts) on New York City police and the good and bad effects of trying to measure crime and police effort
- You may have heard that Senator Elizabeth Warren had a genetic ancestry test. Carl Zimmer has a very good Twitter thread on what the results don’t mean
- ‘The Robots Learn By Watching Us’. Bloomberg columnist Matt Levine on training computers to behave like humans in stock picking and employment
- The New York Times has a map of every building in the United States.
- The Australian Bureau of Statistics is having its funding cut over time, which is probably not a good thing (via). This graph, though:
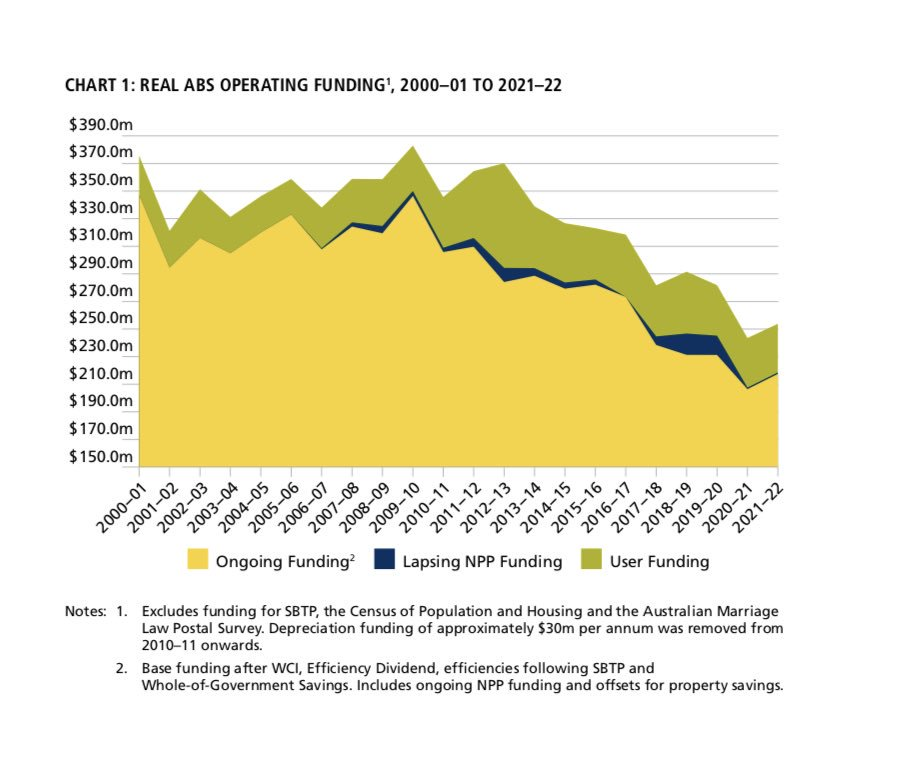
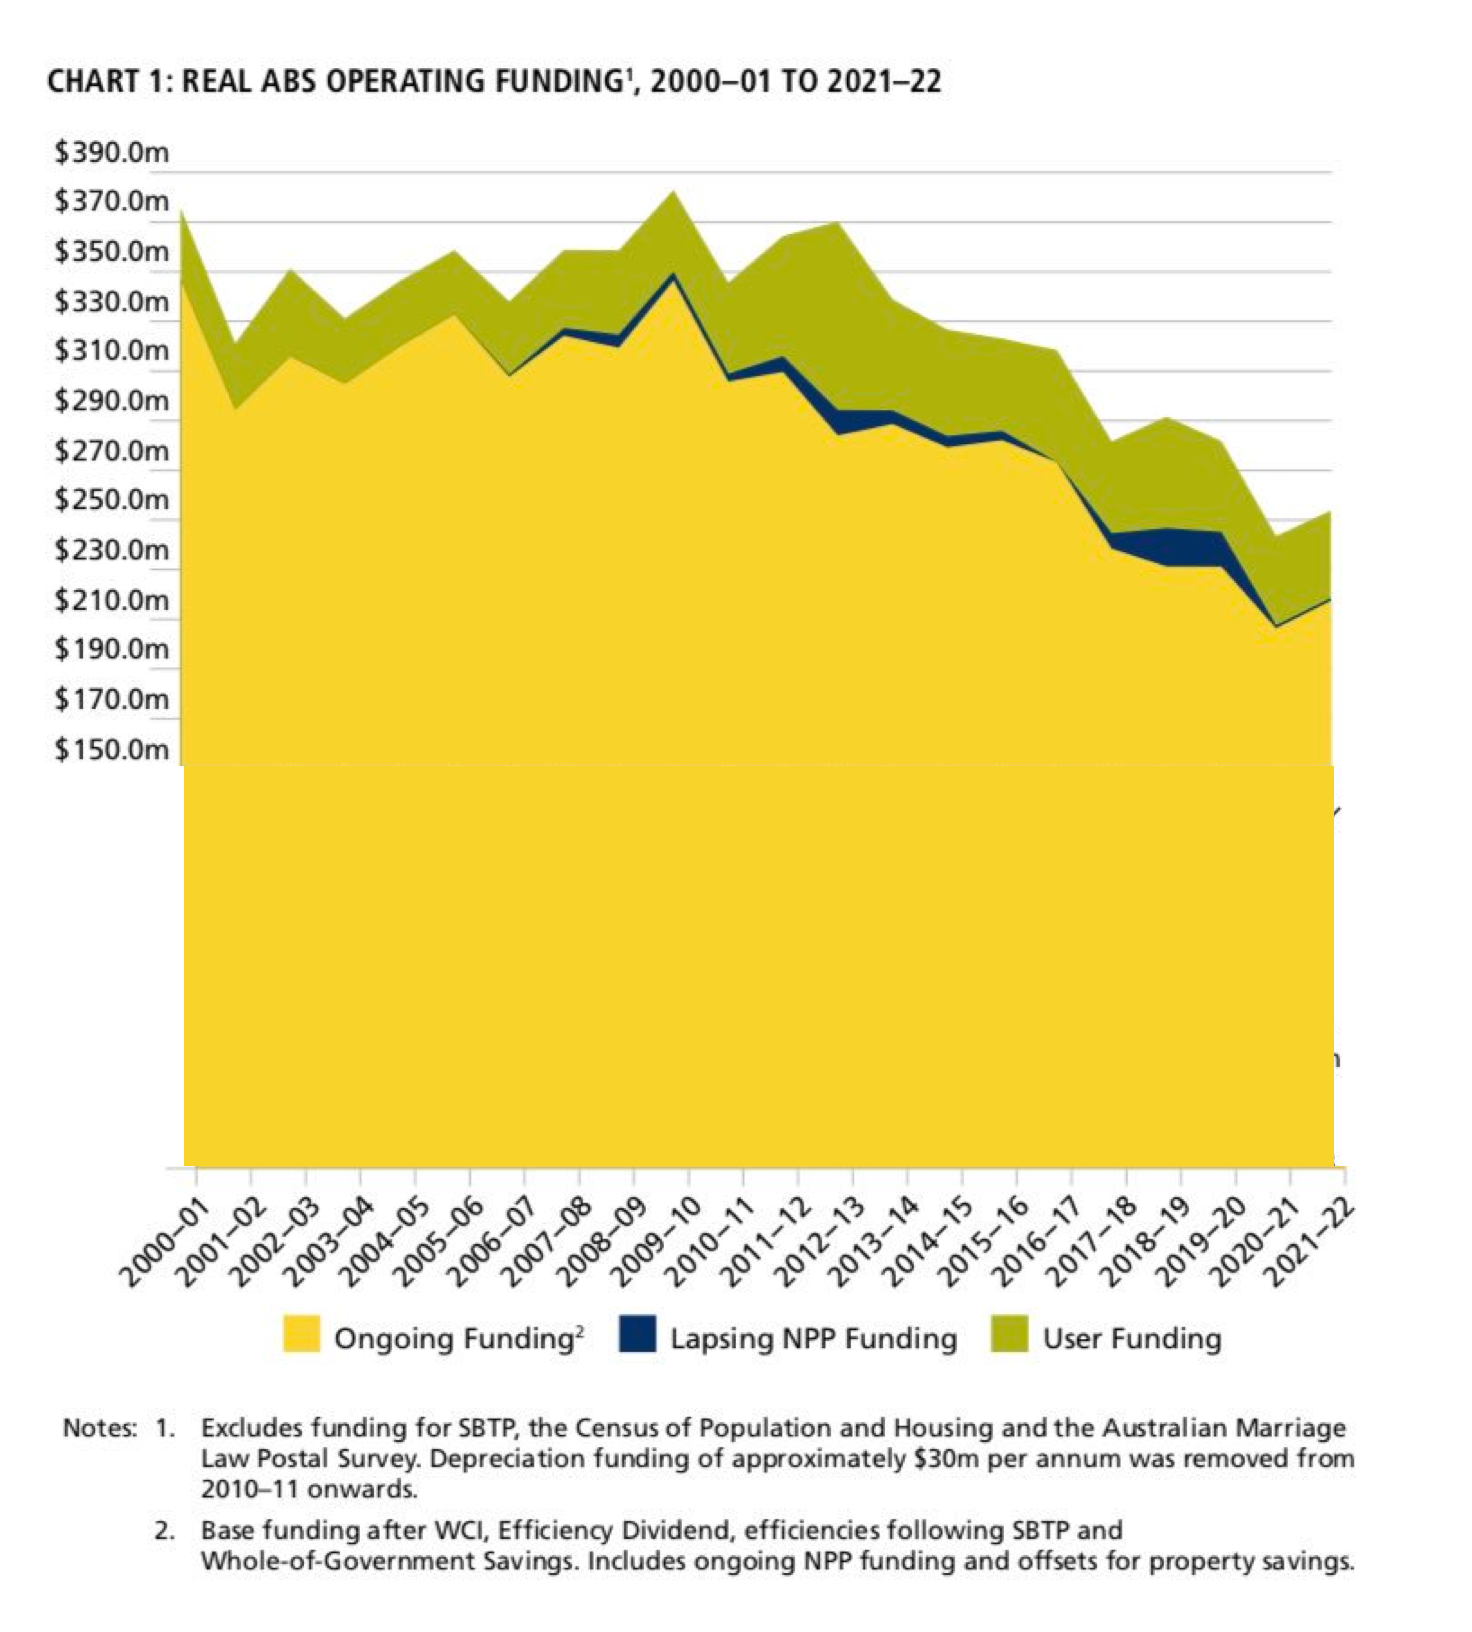
For barcharts and other area charts, the area is carrying the information, so you can’t just chop the bottom half off the graph. I put it back on: -
Thomas Lumley (@tslumley) is Professor of Biostatistics at the University of Auckland. His research interests include semiparametric models, survey sampling, statistical computing, foundations of statistics, and whatever methodological problems his medical collaborators come up with. He also blogs at Biased and Inefficient See all posts by Thomas Lumley »
I wionder if the chart would be better without funding cut. I’m afraid not. Anyway, for a Statistics Bureau is a paradox.
8 years ago