What does that mean?
There’s a nice piece on Stuff about earthquake risk in New Zealand (basically, the geology is out to get us, and we should be prepared).
It includes this map, which comes from “SUPPLIED”
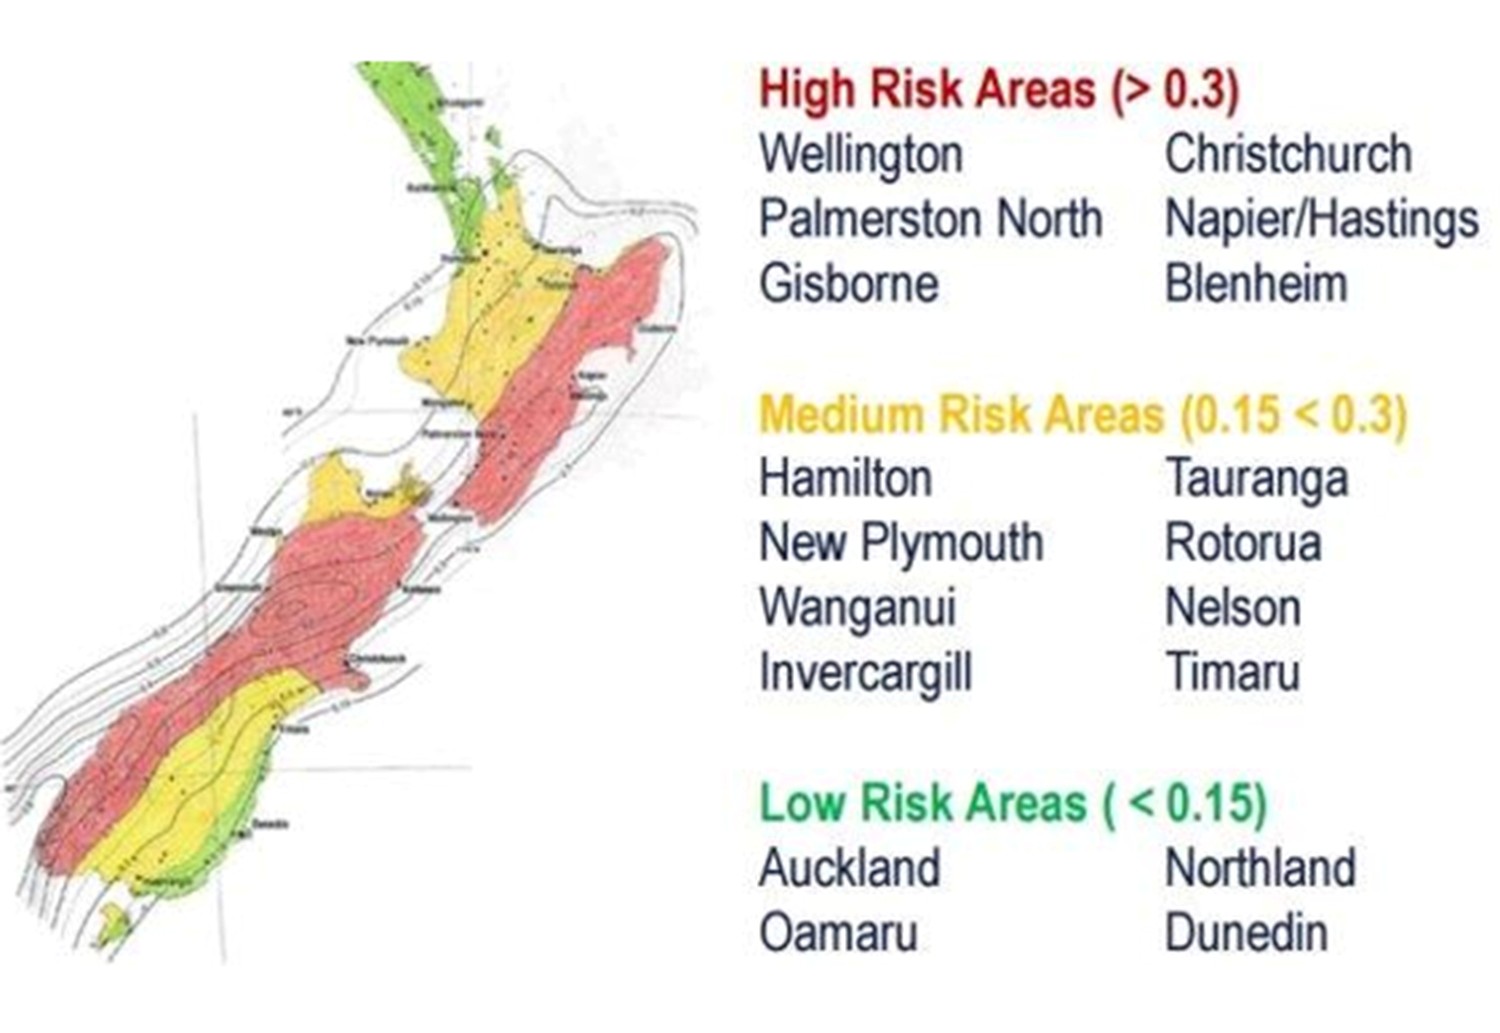
I wondered what the risk numbers (0.15, 0.3) actually meant. Are they some kind of probability of a quake? Over what period of time?
It’s surprisingly hard to find out. The first step is easy: the numbers are seismic risk factors used in the building code, eg, see this map from Radio NZ in 2017
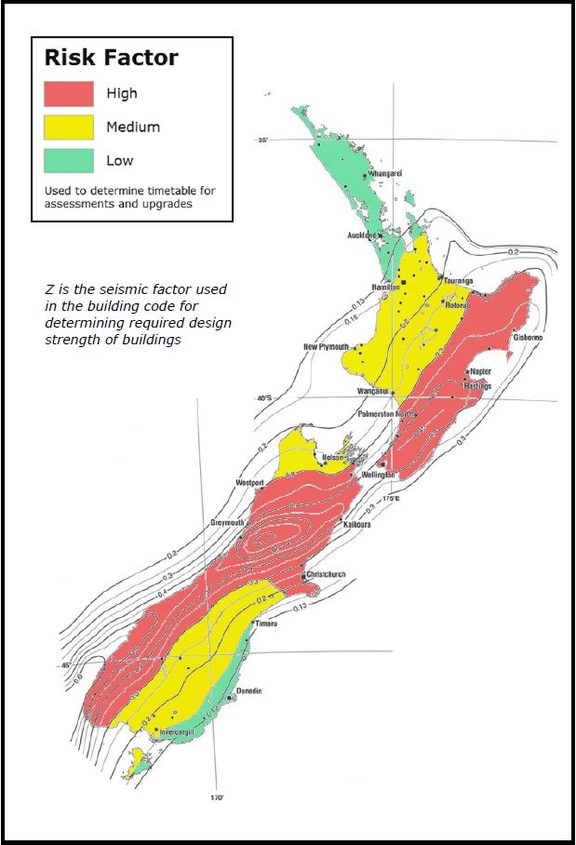
Searching a bit more, you can readily find that (eg, at building.govt.nz) these are the “Z-values to determine seismic risk”, and that there’s
- a low seismic risk if the area has a Z factor that is less than 0.15; and
- a medium seismic risk if the area has a Z factor that is greater than or equal to 0.15 and less than 0.3; and
- a high seismic risk if the area has a Z factor that is greater than or equal to 0.3.
This isn’t getting us much further forward, but there is a reference to a Standard. Now, there are (for some reason) serious penalties over and above the copyright law for being too explicit about the contents of a standard, but you can go and read it for yourself, and verify that Z is a hazard factor that you look up in a table, and that it gets combined with other information about soil and so on to give you a number that goes into how strong your building needs to be. But there isn’t any more explicit explanation of what a Z is.
Searching further, I found a research paper which describes the Australian standards as having a Z that looks very much like the NZ one, defined as the “effective peak ground acceleration with a return period of 500 years”. So, it’s not the probability of a quake, it’s the intensity of the largest quake expected over a 500 year period, in units of the acceleration due to gravity. The US also has a Z with the same definition, though they probably say it ‘zee’.
So, two points: first, it shouldn’t be this much work to find out what the numbers mean on a map published on a major news website. Second, I’m not convinced that ‘seismic risk’ is a good name for this thing, since ‘seismic risk’ sounds more like it should involve probabilities.
Thomas Lumley (@tslumley) is Professor of Biostatistics at the University of Auckland. His research interests include semiparametric models, survey sampling, statistical computing, foundations of statistics, and whatever methodological problems his medical collaborators come up with. He also blogs at Biased and Inefficient See all posts by Thomas Lumley »
First, quite sometime since I applied the information practically and there are many much more skilled in its application. The process is to work from the particular locality feed into the code formula and derive the parameters to to feed the design cases. It is not a process at all friendly to the lay community. As you rightly note probability is very relevant and importantly not clear to a lay person is after the above is understanding the design case is for an event 1 in 50 years and of course ANY time in that period
6 years ago