Posts from August 2021 (21)

August 31, 2021

When data+stories=stories?

This graphic, in a tweet by @heyblake, struck a chord in a lot of people. On the one hand, data together with stories that personalise the statistics can be a very powerful way to communicate.

On the other hand, this story is a lot whiter and greener than the data, and that’s definitely a thing that can happen.

NRL Predictions for Round 25

Team Ratings for Round 25

The basic method is described on my Department home page.
Here are the team ratings prior to this week’s games, along with the ratings at the start of the season.

Current Rating Rating at Season Start Difference
Storm 18.87 14.53 4.30
Rabbitohs 16.27 7.73 8.50
Panthers 11.84 8.88 3.00
Sea Eagles 11.01 -4.77 15.80
Eels 4.13 1.68 2.40
Roosters 3.03 10.25 -7.20
Raiders 1.03 6.98 -5.90
Sharks -1.60 -0.76 -0.80
Titans -2.41 -7.22 4.80
Knights -5.26 -2.61 -2.70
Warriors -5.86 -1.84 -4.00
Wests Tigers -6.96 -3.07 -3.90
Dragons -10.16 -4.95 -5.20
Broncos -10.21 -11.16 0.90
Cowboys -11.51 -8.05 -3.50
Bulldogs -14.22 -7.62 -6.60


Performance So Far

So far there have been 184 matches played, 134 of which were correctly predicted, a success rate of 72.8%.
Here are the predictions for last week’s games.

Game Date Score Prediction Correct
1 Knights vs. Titans Aug 26 15 – 14 -3.70 FALSE
2 Warriors vs. Raiders Aug 27 16 – 28 -5.70 TRUE
3 Roosters vs. Rabbitohs Aug 27 12 – 54 -7.40 TRUE
4 Dragons vs. Cowboys Aug 28 26 – 38 4.20 FALSE
5 Sharks vs. Broncos Aug 28 24 – 16 5.00 TRUE
6 Storm vs. Eels Aug 28 10 – 22 20.10 FALSE
7 Sea Eagles vs. Bulldogs Aug 29 36 – 18 26.80 TRUE
8 Panthers vs. Wests Tigers Aug 29 30 – 16 19.90 TRUE


Predictions for Round 25

Here are the predictions for Round 25. The prediction is my estimated expected points difference with a positive margin being a win to the home team, and a negative margin a win to the away team.

Game Date Winner Prediction
1 Raiders vs. Roosters Sep 02 Raiders 1.00
2 Sharks vs. Storm Sep 03 Storm -17.50
3 Eels vs. Panthers Sep 03 Panthers -4.70
4 Broncos vs. Knights Sep 04 Knights -1.90
5 Cowboys vs. Sea Eagles Sep 04 Sea Eagles -19.50
6 Rabbitohs vs. Dragons Sep 04 Rabbitohs 29.40
7 Titans vs. Warriors Sep 05 Titans 6.40
8 Wests Tigers vs. Bulldogs Sep 05 Wests Tigers 10.30


Currie Cup Predictions for the Semi Finals

Team Ratings for the Semi Finals

The basic method is described on my Department home page.
Here are the team ratings prior to this week’s games, along with the ratings at the start of the season.

Current Rating Rating at Season Start Difference
Bulls 5.83 5.14 0.70
Sharks 5.55 5.19 0.40
Western Province 1.87 3.28 -1.40
Lions -1.88 3.74 -5.60
Cheetahs -2.70 -2.17 -0.50
Pumas -3.31 -5.67 2.40
Griquas -5.36 -9.50 4.10


Performance So Far

So far there have been 35 matches played, 21 of which were correctly predicted, a success rate of 60%.
Here are the predictions for last week’s games.

Game Date Score Prediction Correct
1 Griquas vs. Pumas Aug 28 13 – 13 1.20 FALSE
2 Bulls vs. Cheetahs Aug 29 39 – 36 12.40 TRUE
3 Sharks vs. Western Province Aug 29 24 – 35 8.10 FALSE


Predictions for the Semi Finals

Here are the predictions for the Semi Finals. The prediction is my estimated expected points difference with a positive margin being a win to the home team, and a negative margin a win to the away team.

Game Date Winner Prediction
1 Sharks vs. Griquas Sep 04 Sharks 13.90
2 Bulls vs. Western Province Sep 04 Bulls 7.00


August 28, 2021

Up or down?

Having been exposed for the past year and half to stories about the ‘basic reproduction number’ and ‘effective reproduction number’ of Covid, you might ask ‘what is Reff at the moment?’

It’s hard to say. Firstly, it’s not really Covid that has an effective reproduction number but SARS-Cov-2; not the disease, but the virus.  The reproduction number is a feature of models for infection, not models for illness or even for confirmed cases.  Trends in illness or in the number of confirmed cases are important, but they are separated from trends in infection by the whole process of diagnosis, testing, and tracing. Right now, testing is on overdrive: people with minor symptoms are tesing (yay them!) and people with no symptoms but even minor contact with a case are testing (yay them, too!). As a result, cases are much more likely to be diagnosed than they were, say, two weeks ago.

In the long run, under constant conditions, the outbreak will have exponential growth or decay. In the long run, even quite large changes in the diagnosis, testing, and tracing process will be swamped by the much larger changes in the underlying infection rates. In the long run it will be obvious if total infections are going up or down and the rate can be estimated fairly well from confirmed cases. But in the long run we are all in level 1, so that’s not very satisfying.

At the moment, we have a reasonable hope that the population is effectively partitioned into bubbles, with much lower spread between bubbles than within bubbles.  If so, new confirmed cases will mostly either be new diagnoses of cases infected a while ago, or cases who got it from someone in their bubble.  For example, a lot of people who work in the same building as the Stats Department were being tested yesterday, in case they had been infected on August 17.

The number of cases like these is important, because we care about their health, but doesn’t really tell us about the effectiveness of level 4 lockdown, which is about the relatively small number of new between-bubble transmissions from people who were not yet diagnosed.  Calculating effective reproduction numbers from the number of observed cases isn’t going to be very accurate.

All this goes to say that, yes, we have good reason to hope the out-of-bubble reproduction number is well under 1, but the actual value genuinely is hard to estimate — and it’s particularly hard to estimate just from public data on numbers of newly confirmed cases.

August 26, 2021

Bogus poll lockdown headlines

The Herald had a story and headline based on a bogus online clicky poll today: Covid 19 coronavirus Delta outbreak: Majority vote for South Island alert level change

As we’ve seen in the past, bogus online polls can be very misleading. That last link, for example, compares three bogus polls from the same time period on the same question, whose results differed by more than you’d expect for random samples of only ten people.

The Herald does try to wiggle a bit on interpretation; the story starts “The votes are in and it is clear whether or not Herald readers think the South Island should stay in lockdown after Friday”. But the 70,000-odd votes are a tiny proportion of what the Herald claims as its readership: in January, they reported 610,000 daily print subscribers, 1.9 million monthly unique viewers on the blog, and a weekly ‘brand audience’ of over two million. There’s no reason to expect the poll responses are representative of any of those Herald readerships, either.

Usually one could argue that the bogus polls don’t do any major harm; they just amount to pissing in the swimming pool of public discourse. Usually they don’t get headlines. Usually they aren’t about a sensitive policy question in the middle of a pandemic. If the accuracy of the  numbers matters, you don’t want a bogus poll; if the accuracy doesn’t matter they shouldn’t be the basis for a lockdown-related headline

August 24, 2021

Top 14 Predictions for Round 1

Team Ratings for Round 1

The basic method is described on my Department home page.
Here are the team ratings prior to this week’s games, along with the ratings at the start of the season.

Current Rating Rating at Season Start Difference
Stade Toulousain 6.83 6.83 0.00
La Rochelle 6.78 6.78 -0.00
Racing-Metro 92 6.13 6.13 -0.00
Bordeaux-Begles 5.42 5.42 0.00
Clermont Auvergne 5.09 5.09 -0.00
Lyon Rugby 4.15 4.15 -0.00
RC Toulonnais 1.82 1.82 0.00
Stade Francais Paris 1.20 1.20 -0.00
Castres Olympique 0.94 0.94 -0.00
Montpellier -0.01 -0.01 -0.00
Section Paloise -2.25 -2.25 -0.00
Biarritz -2.78 -2.78 -0.00
USA Perpignan -2.78 -2.78 -0.00
Brive -3.19 -3.19 -0.00


Predictions for Round 1

Here are the predictions for Round 1. The prediction is my estimated expected points difference with a positive margin being a win to the home team, and a negative margin a win to the away team.

Game Date Winner Prediction
1 Biarritz vs. Bordeaux-Begles Sep 04 Bordeaux-Begles -1.70
2 Brive vs. USA Perpignan Sep 05 Brive 6.10
3 Castres Olympique vs. Section Paloise Sep 05 Castres Olympique 9.70
4 Stade Francais Paris vs. Racing-Metro 92 Sep 05 Stade Francais Paris 1.60
5 RC Toulonnais vs. Montpellier Sep 05 RC Toulonnais 8.30
6 Lyon Rugby vs. Clermont Auvergne Sep 06 Lyon Rugby 5.60
7 La Rochelle vs. Stade Toulousain Sep 06 La Rochelle 6.50


NRL Predictions for Round 24

Team Ratings for Round 24

The basic method is described on my Department home page.
Here are the team ratings prior to this week’s games, along with the ratings at the start of the season.

Current Rating Rating at Season Start Difference
Storm 21.58 14.53 7.00
Rabbitohs 13.37 7.73 5.60
Panthers 12.38 8.88 3.50
Sea Eagles 11.80 -4.77 16.60
Roosters 5.93 10.25 -4.30
Eels 1.43 1.68 -0.30
Raiders 0.46 6.98 -6.50
Sharks -1.90 -0.76 -1.10
Titans -1.97 -7.22 5.30
Warriors -5.29 -1.84 -3.40
Knights -5.70 -2.61 -3.10
Wests Tigers -7.50 -3.07 -4.40
Dragons -8.75 -4.95 -3.80
Broncos -9.91 -11.16 1.20
Cowboys -12.91 -8.05 -4.90
Bulldogs -15.01 -7.62 -7.40


Performance So Far

So far there have been 176 matches played, 129 of which were correctly predicted, a success rate of 73.3%.
Here are the predictions for last week’s games.

Game Date Score Prediction Correct
1 Titans vs. Storm Aug 19 20 – 34 -22.00 TRUE
2 Raiders vs. Sea Eagles Aug 20 18 – 19 -13.60 TRUE
3 Panthers vs. Rabbitohs Aug 20 25 – 12 -3.90 FALSE
4 Wests Tigers vs. Sharks Aug 21 20 – 50 -0.60 TRUE
5 Bulldogs vs. Knights Aug 21 16 – 22 -10.10 TRUE
6 Eels vs. Cowboys Aug 21 32 – 16 13.90 TRUE
7 Dragons vs. Roosters Aug 22 22 – 40 -13.90 TRUE
8 Broncos vs. Warriors Aug 22 24 – 22 -2.40 FALSE


Predictions for Round 24

Here are the predictions for Round 24. The prediction is my estimated expected points difference with a positive margin being a win to the home team, and a negative margin a win to the away team.

Game Date Winner Prediction
1 Knights vs. Titans Aug 26 Titans -3.70
2 Warriors vs. Raiders Aug 27 Raiders -5.70
3 Roosters vs. Rabbitohs Aug 27 Rabbitohs -7.40
4 Dragons vs. Cowboys Aug 28 Dragons 4.20
5 Sharks vs. Broncos Aug 28 Sharks 5.00
6 Storm vs. Eels Aug 28 Storm 20.10
7 Sea Eagles vs. Bulldogs Aug 29 Sea Eagles 26.80
8 Panthers vs. Wests Tigers Aug 29 Panthers 19.90


Currie Cup Predictions for Round 14

Team Ratings for Round 14

The basic method is described on my Department home page.
Here are the team ratings prior to this week’s games, along with the ratings at the start of the season.

Current Rating Rating at Season Start Difference
Bulls 6.26 5.14 1.10
Sharks 6.26 5.19 1.10
Western Province 1.17 3.28 -2.10
Lions -1.88 3.74 -5.60
Cheetahs -3.13 -2.17 -1.00
Pumas -3.41 -5.67 2.30
Griquas -5.26 -9.50 4.20


Performance So Far

So far there have been 32 matches played, 20 of which were correctly predicted, a success rate of 62.5%.
Here are the predictions for last week’s games.

Game Date Score Prediction Correct
1 Griquas vs. Western Province Aug 21 46 – 25 -5.20 FALSE
2 Pumas vs. Cheetahs Aug 21 28 – 19 2.00 TRUE
3 Lions vs. Sharks Aug 22 14 – 56 -2.80 TRUE


Predictions for Round 14

Here are the predictions for Round 14. The prediction is my estimated expected points difference with a positive margin being a win to the home team, and a negative margin a win to the away team.

Game Date Winner Prediction
1 Griquas vs. Pumas Aug 28 Griquas 1.20
2 Bulls vs. Cheetahs Aug 29 Bulls 12.40
3 Sharks vs. Western Province Aug 29 Sharks 8.10


August 19, 2021

Currie Cup Predictions for Round 13

Team Ratings for Round 13

The basic method is described on my Department home page.
Here are the team ratings prior to this week’s games, along with the ratings at the start of the season.

Current Rating Rating at Season Start Difference
Bulls 6.26 5.14 1.10
Sharks 5.08 5.19 -0.10
Western Province 2.05 3.28 -1.20
Lions -0.71 3.74 -4.50
Cheetahs -2.78 -2.17 -0.60
Pumas -3.76 -5.67 1.90
Griquas -6.15 -9.50 3.40


Performance So Far

So far there have been 29 matches played, 18 of which were correctly predicted, a success rate of 62.1%.
Here are the predictions for last week’s games.

Game Date Score Prediction Correct
1 Pumas vs. Bulls Aug 18 26 – 33 -7.00 TRUE
2 Cheetahs vs. Griquas Aug 18 33 – 32 7.00 TRUE
3 Western Province vs. Lions Aug 19 35 – 13 4.40 TRUE


Predictions for Round 13

Here are the predictions for Round 13. The prediction is my estimated expected points difference with a positive margin being a win to the home team, and a negative margin a win to the away team.

Game Date Winner Prediction
1 Griquas vs. Western Province Aug 21 Western Province -5.20
2 Pumas vs. Cheetahs Aug 21 Pumas 2.00
3 Lions vs. Sharks Aug 22 Sharks -2.80


August 17, 2021

Transit and weather

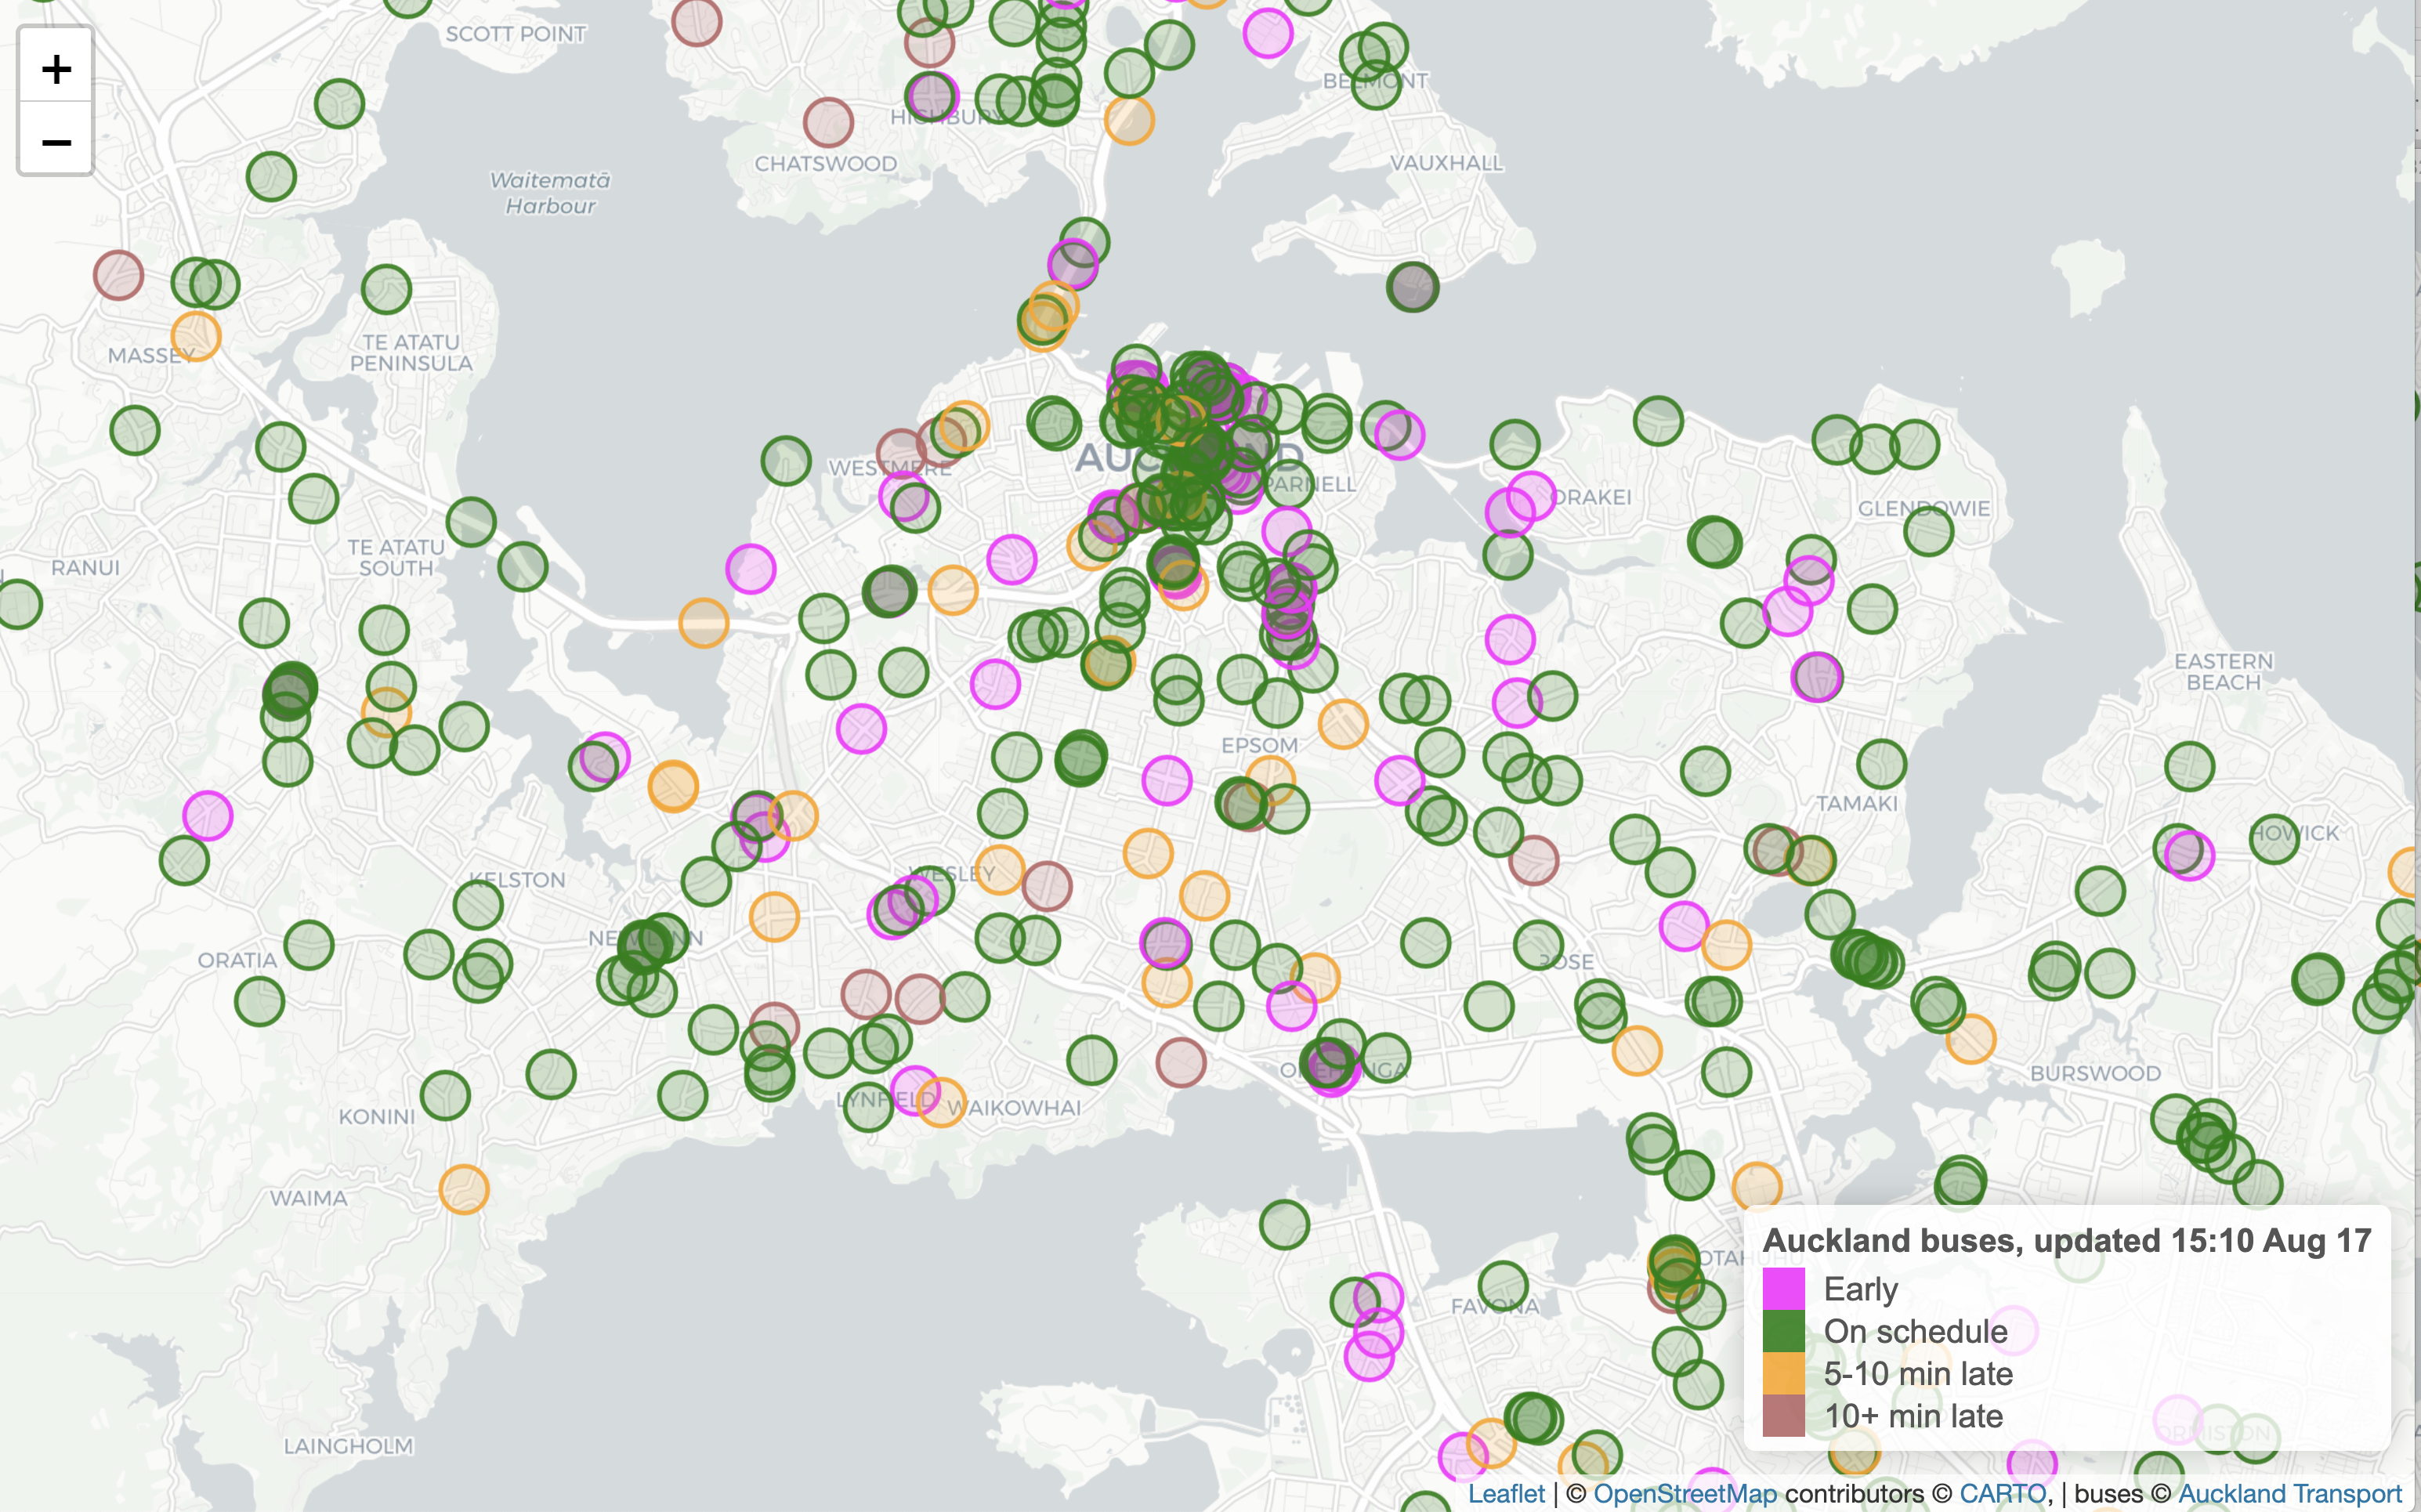
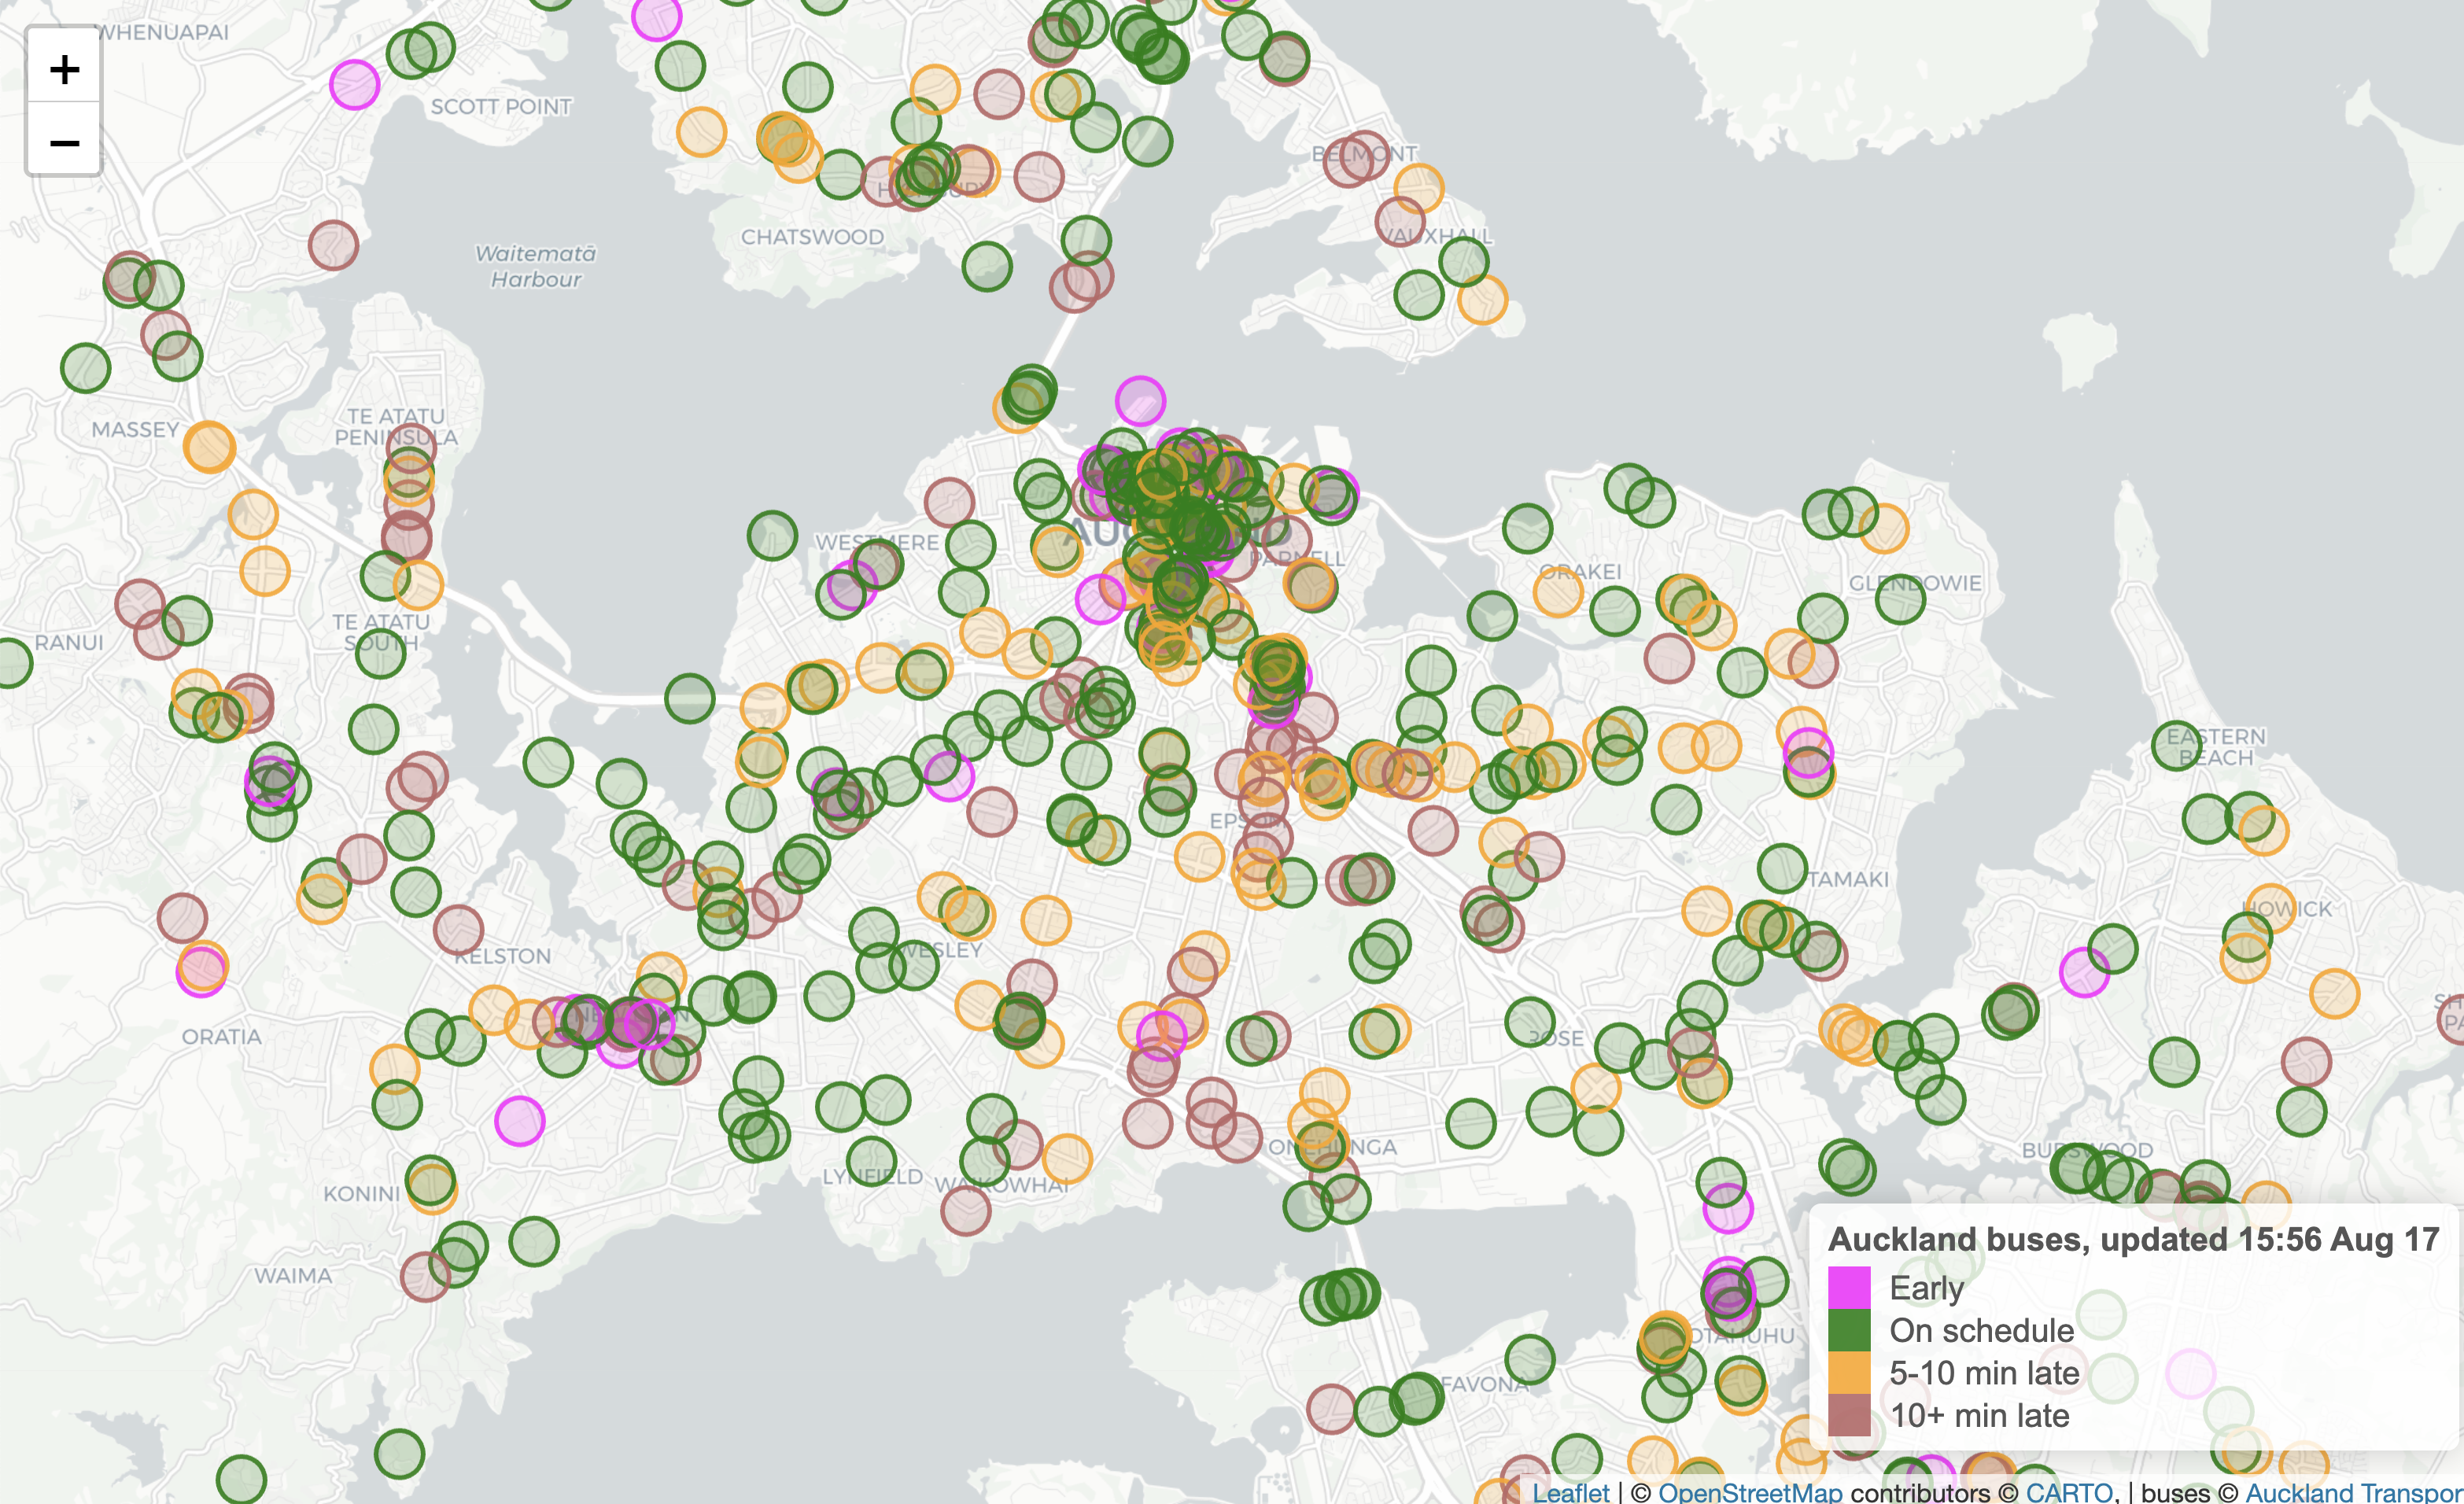
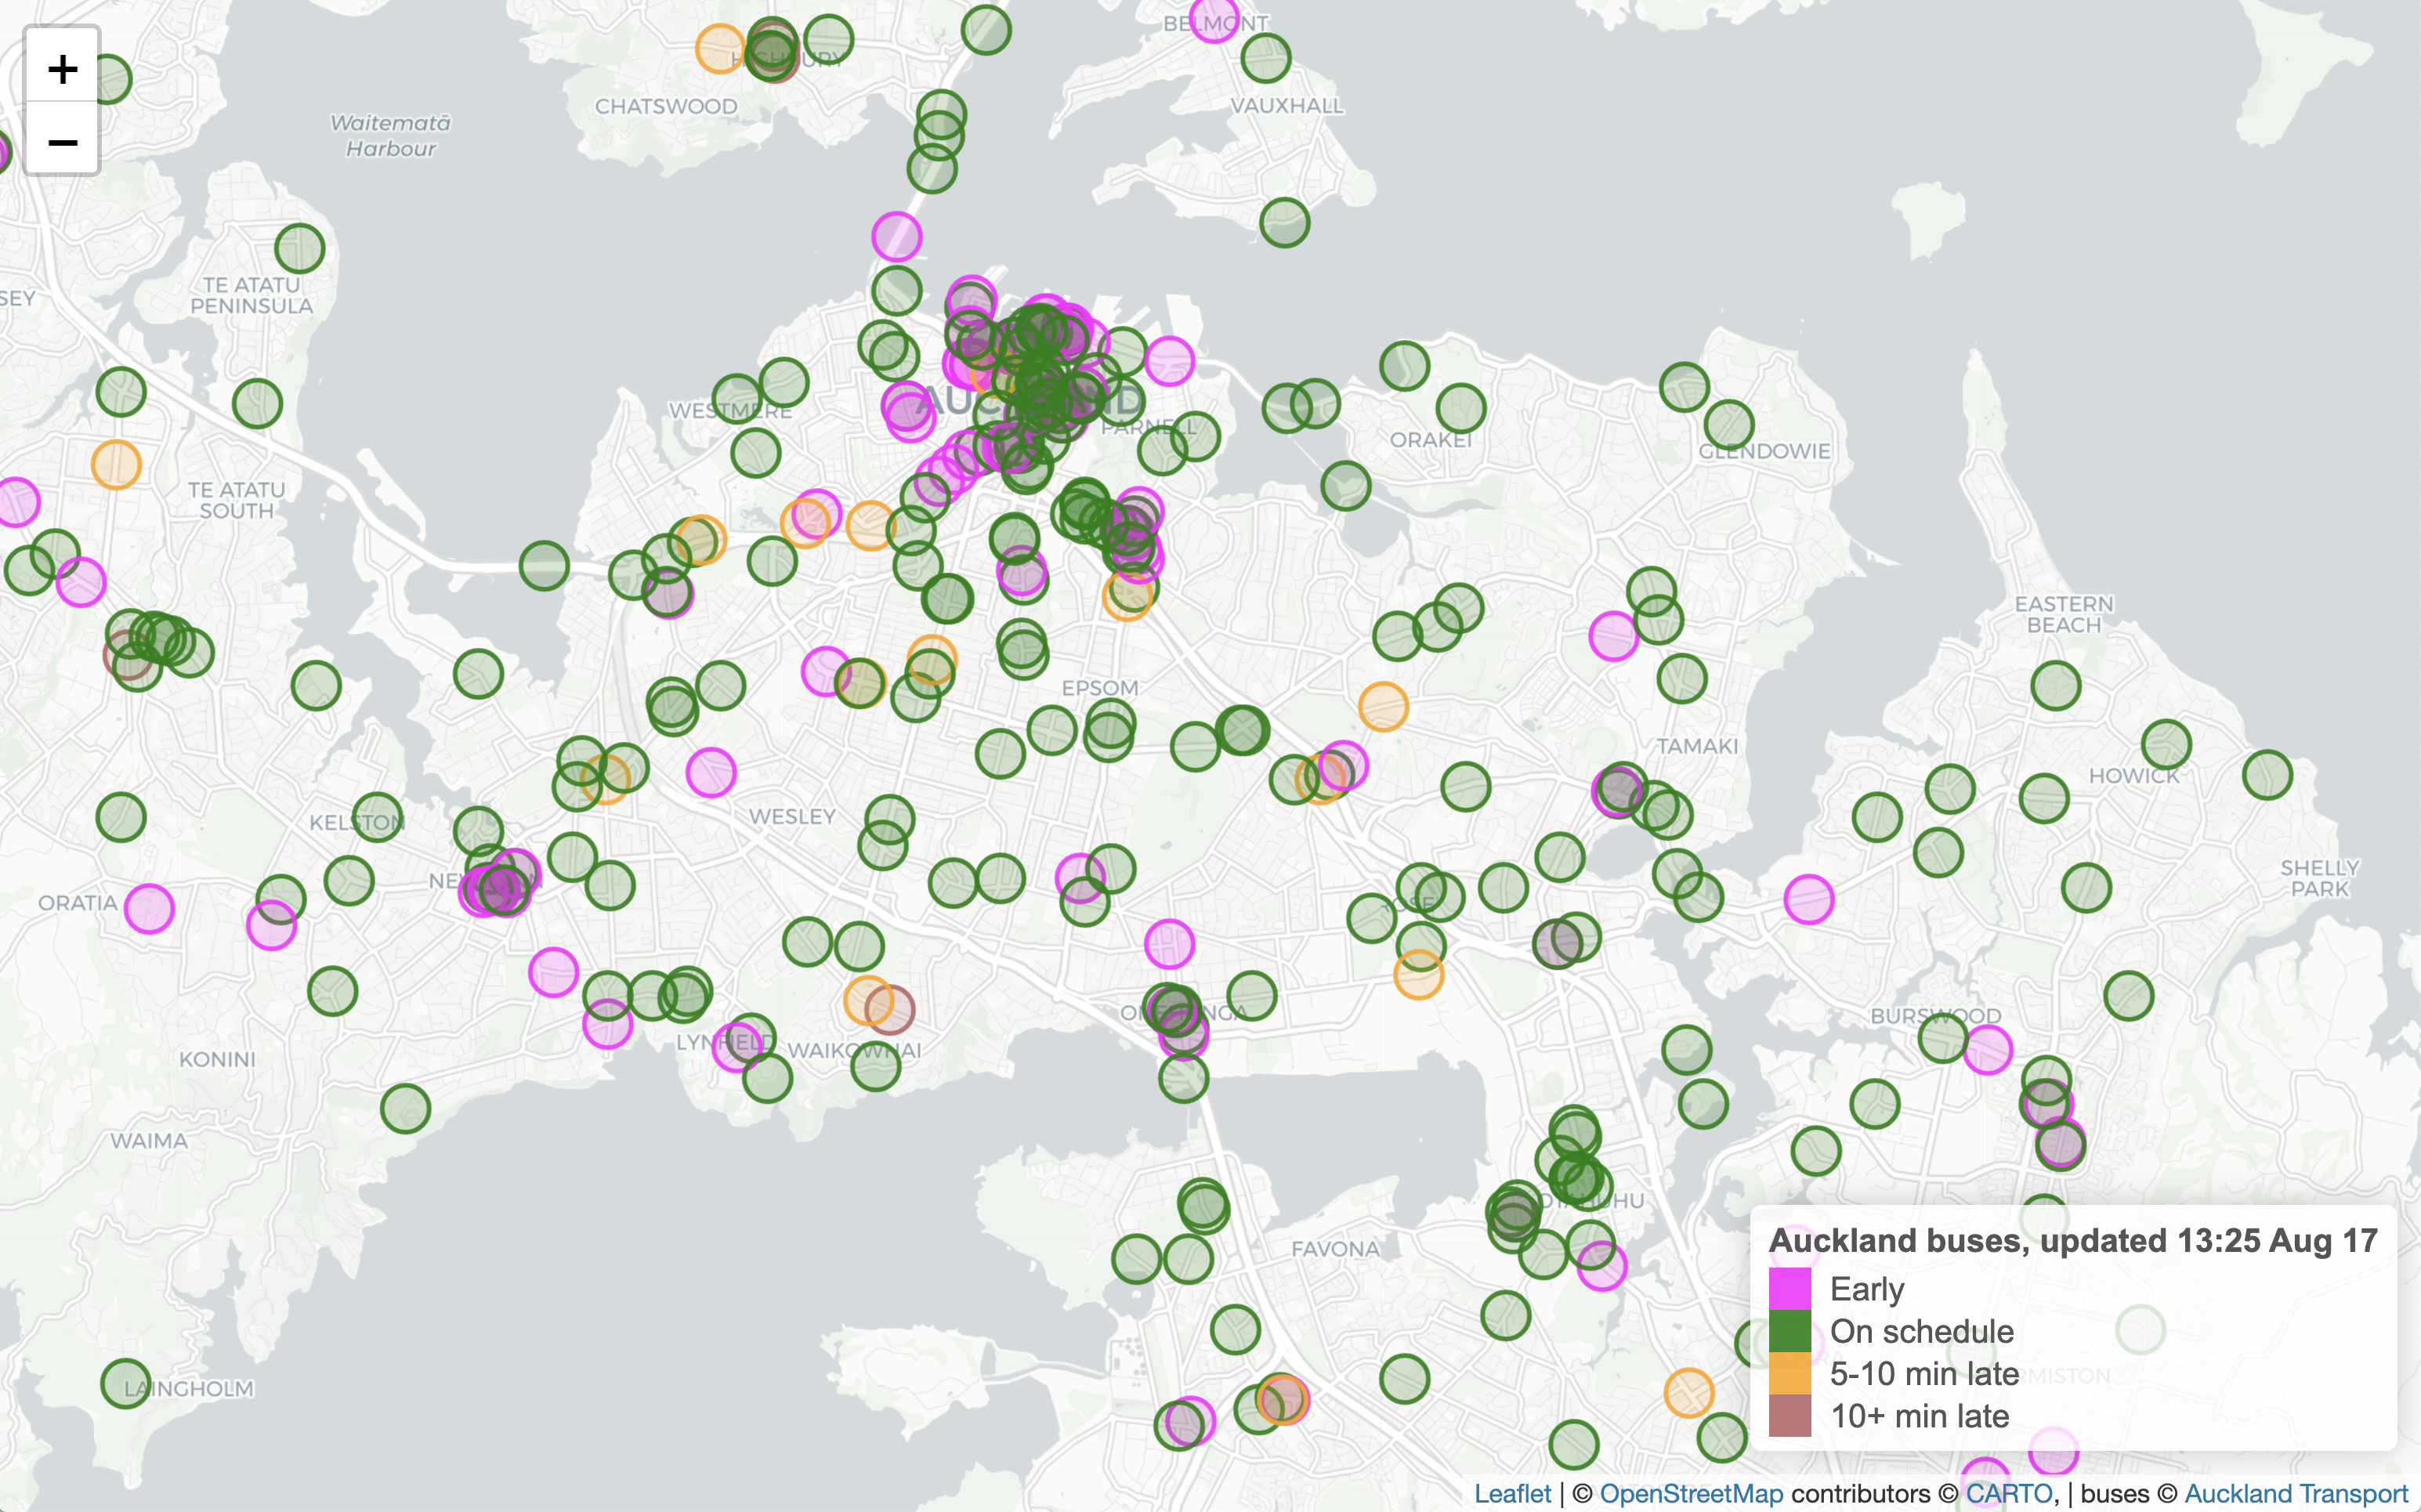
Not news-related, but just an observation from today while I was working on real-time bus data

At 1:30pm, just over 80% of buses were on time (by my fairly stringent metric of all buses; all stops).

That was just before a band of strong wind and moderately heavy rain. Afterwards, at 3:15pm, we’re down to about 70% of buses on time

Update: 4pm: — 53% on time

Rain messes up Auckland traffic, so it will inevitably mess up buses to some extent– bus lanes help, but even with bus lanes, they are affected by other traffic at most intersections.  There isn’t any straightforward solution; making buses allow lots of extra time and take regular naps along the route might fix the on-time metric, but it wouldn’t fix the problem.

PS: The interactive map –when it’s working — is here; the corresponding Wellington one is here

PPS: Bus performance has continued to deteriorate, but now it’s probably down to the likely coming Covid lockdown. Masks on public transport, folks. It’s not just the law, it’s a good idea