Is Roy Morgan weird yet?
Some years ago, at the behest of Kiwi Nerd Twitter, I looked at whether the Roy Morgan poll results varied more than those from other organisations, and concluded that they didn’t. It was just that Roy Morgan published polls more often. They had a larger number of surprising results because they had a larger number of results. Kiwi Nerd Twitter has come back, asking for a repeat.
I’m going to do analyses of two ways of measuring weirdness, for the major and semi-major parties. All the data comes from Wikipedia’s “Opinion polling for the next NZ Election“, so it runs from the last election to now. First, I’ll look at National.
The first analysis is to look at departures from the general trend. The general trend for National (from a spline smoother, fitted in R’s mgcv package, in a model that also has organisation effects) looks like this:
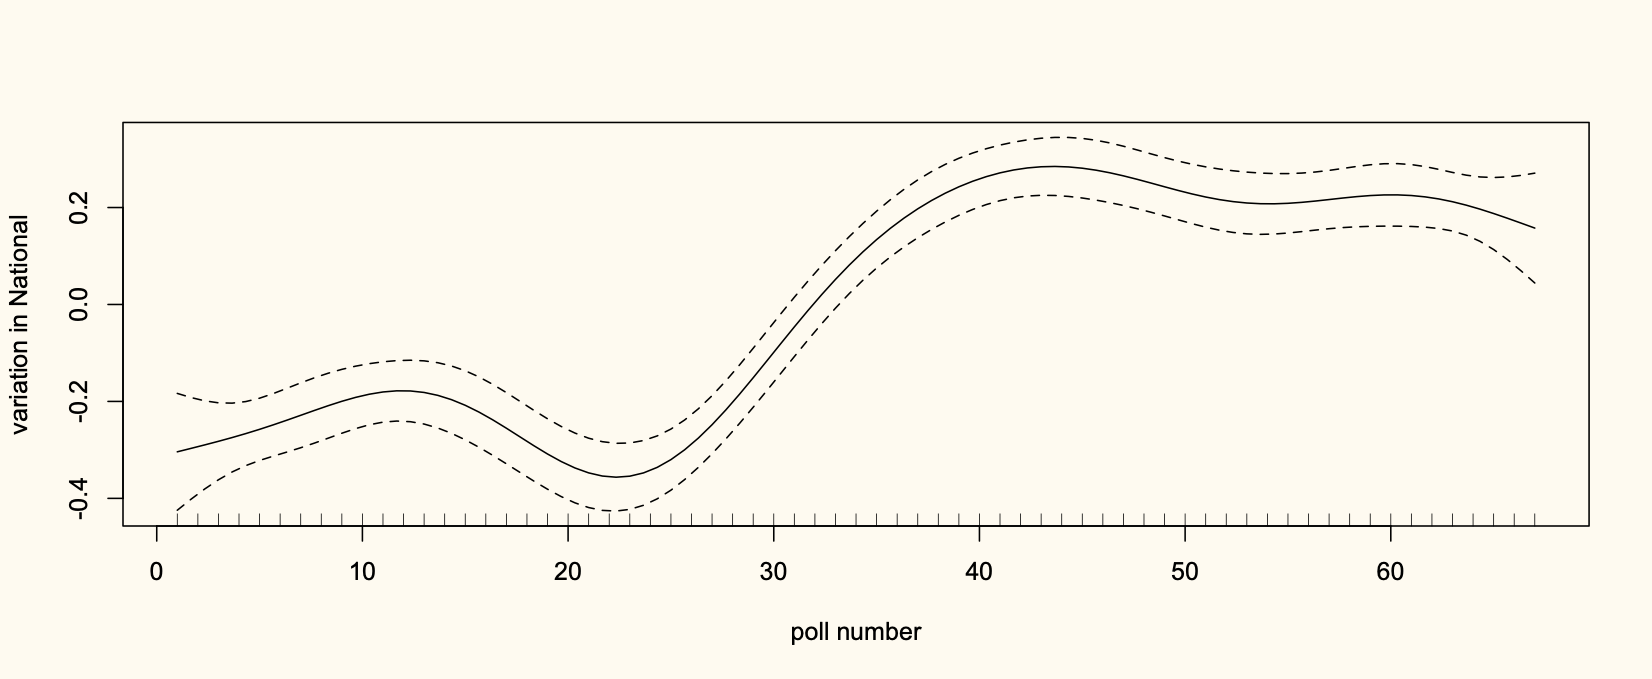
Support was low; it went up.
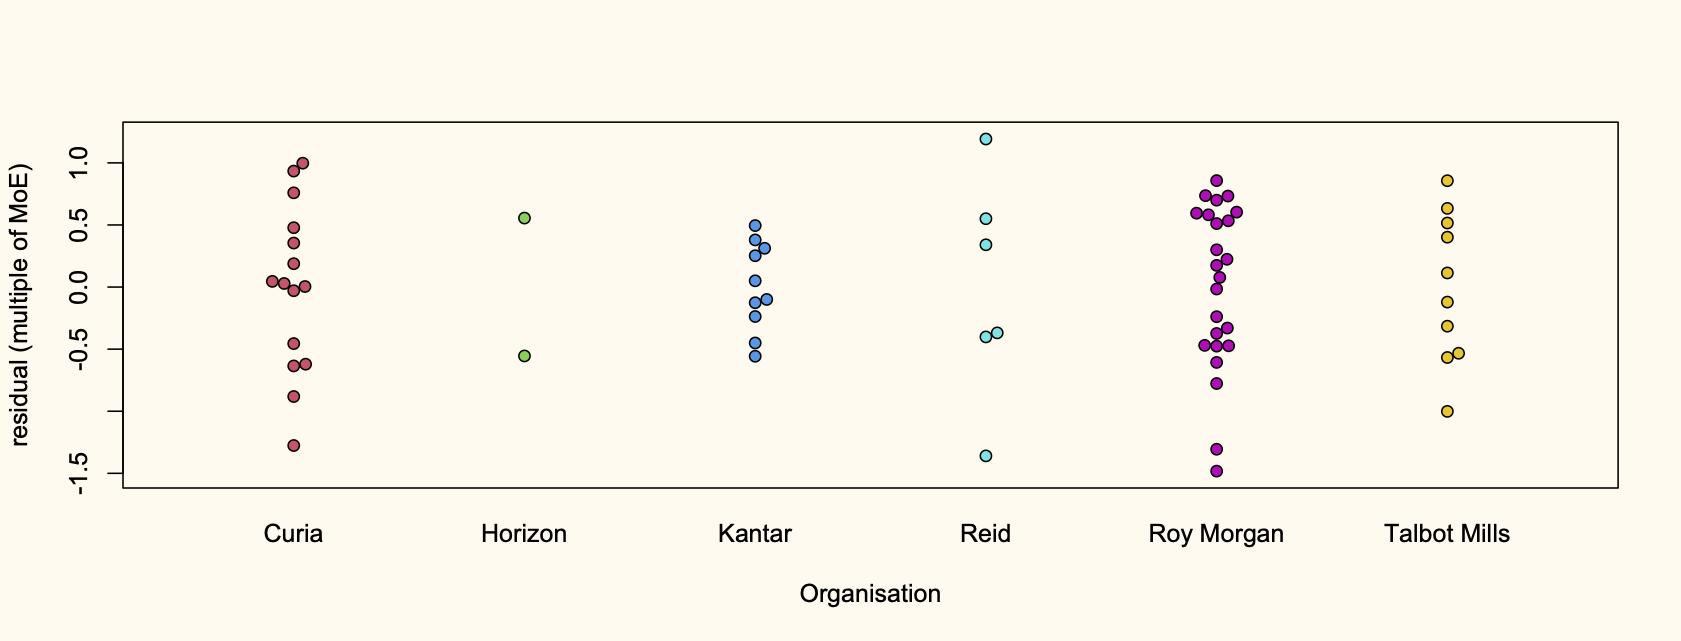
I subtracted off the trend, and scaled the departures by the margin of error (not the maximum margin of error). Here they are, split up by polling organisation
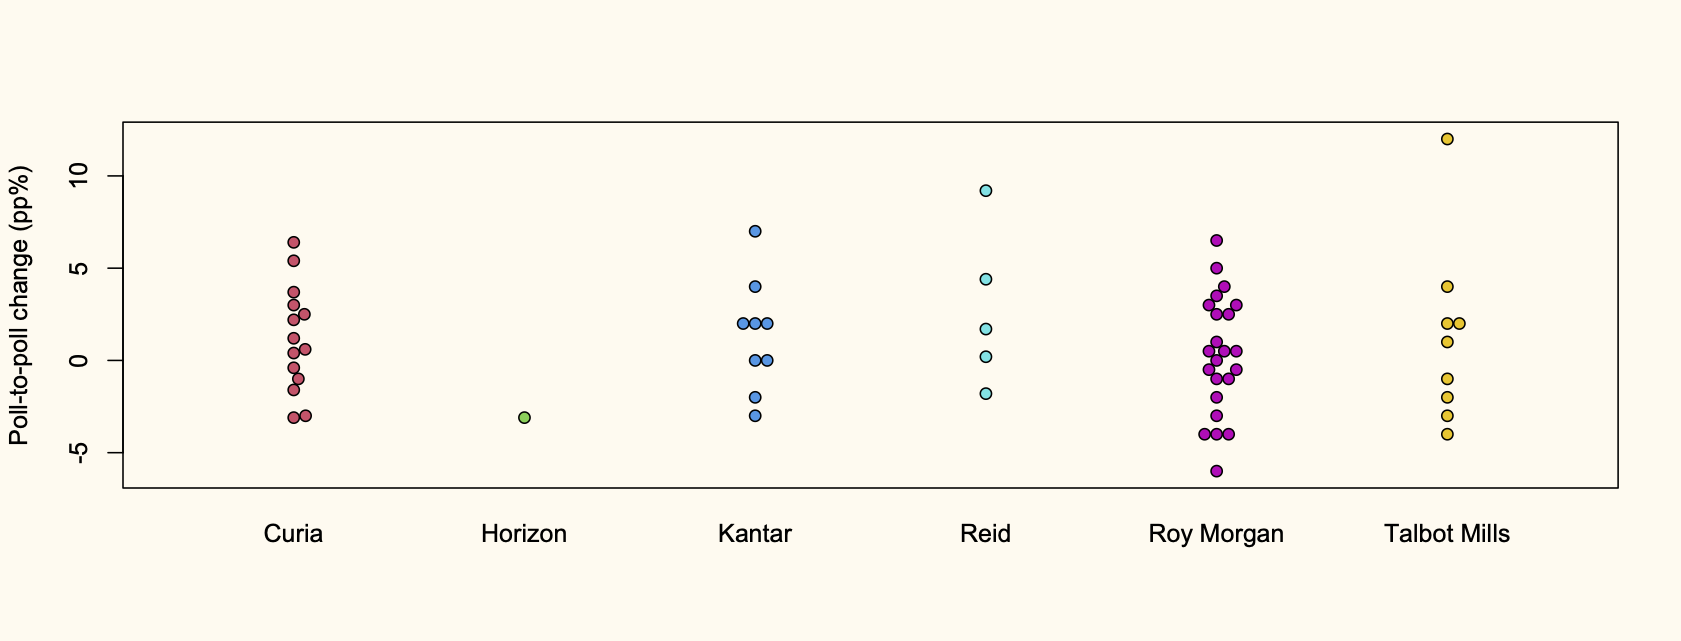
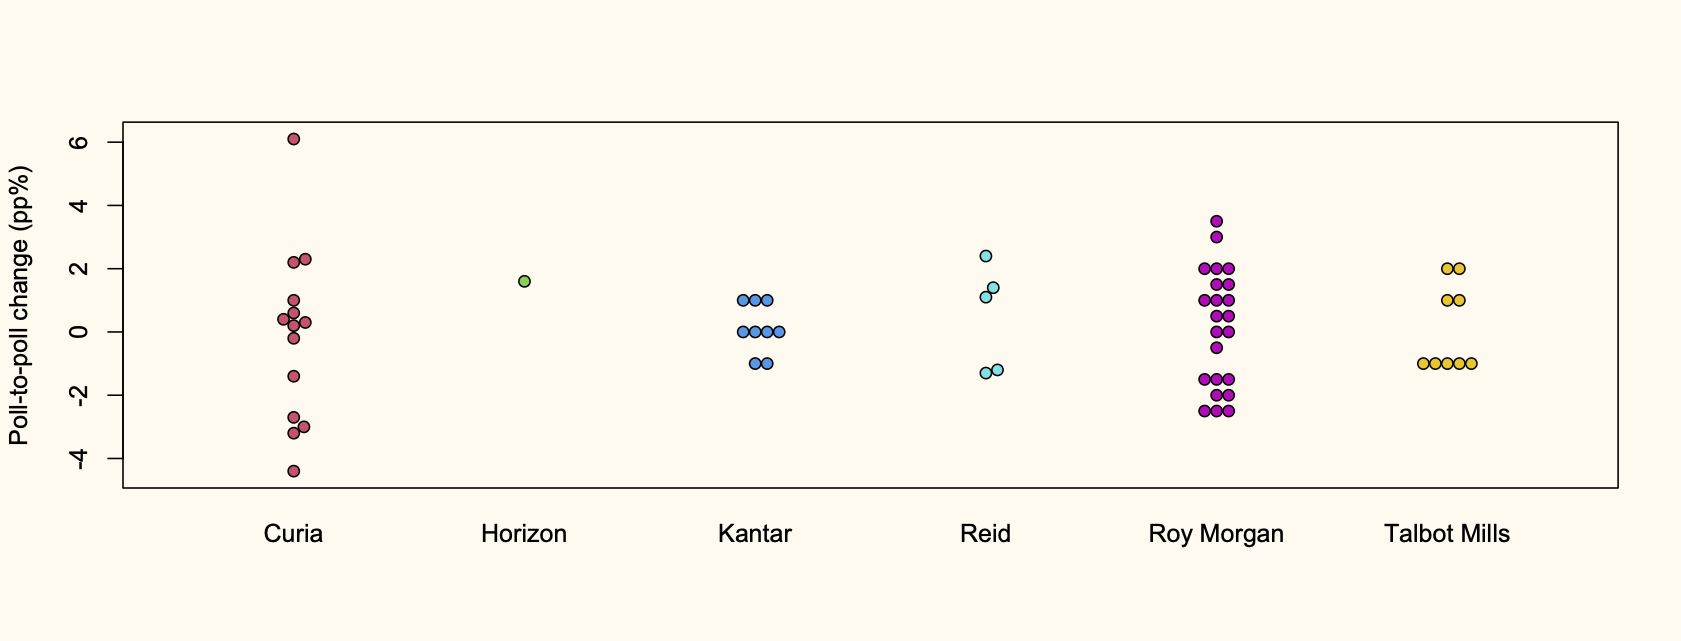
The other analysis I did was to look at poll-to-poll changes, without any modelling of trend. The units for these are just percentage points.
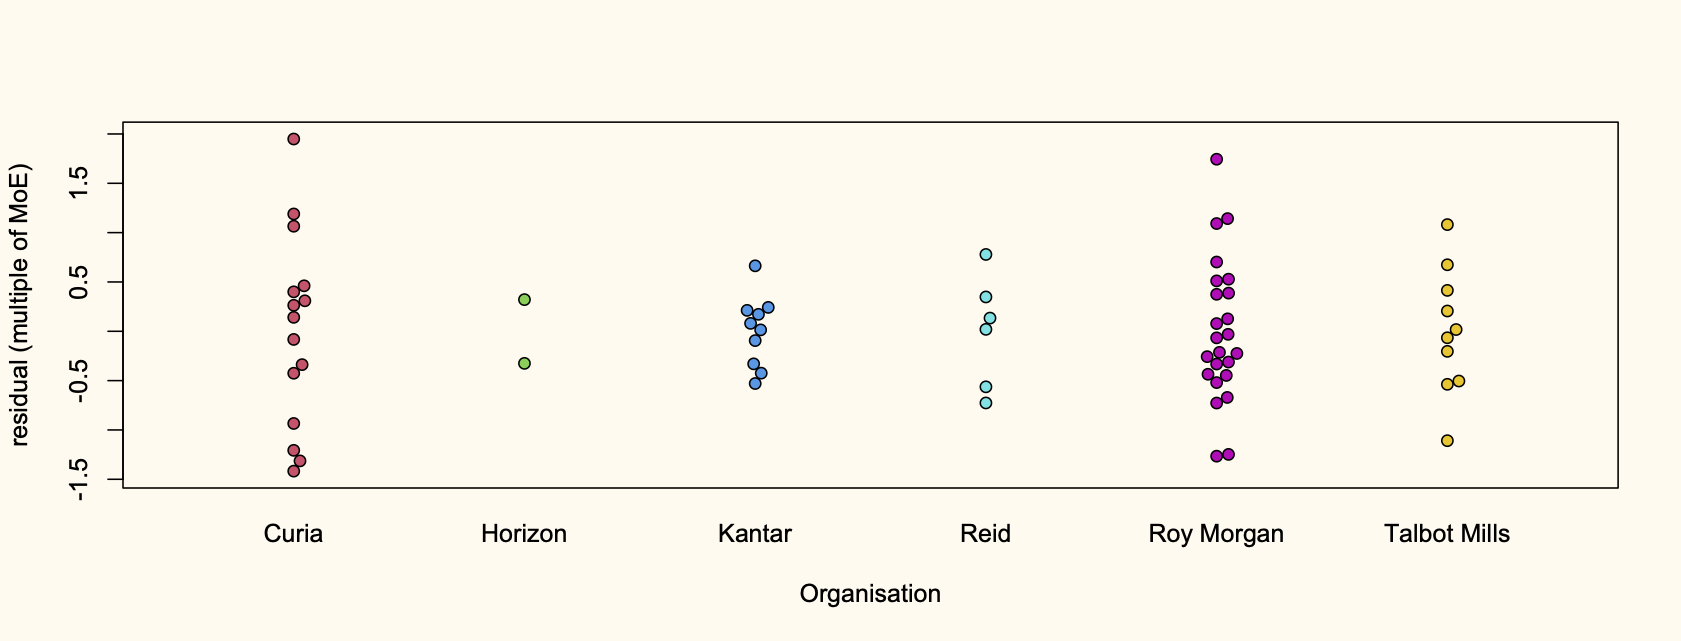
Next, the same things for Green Party support: departures from their overall trend
And poll-to-poll differences
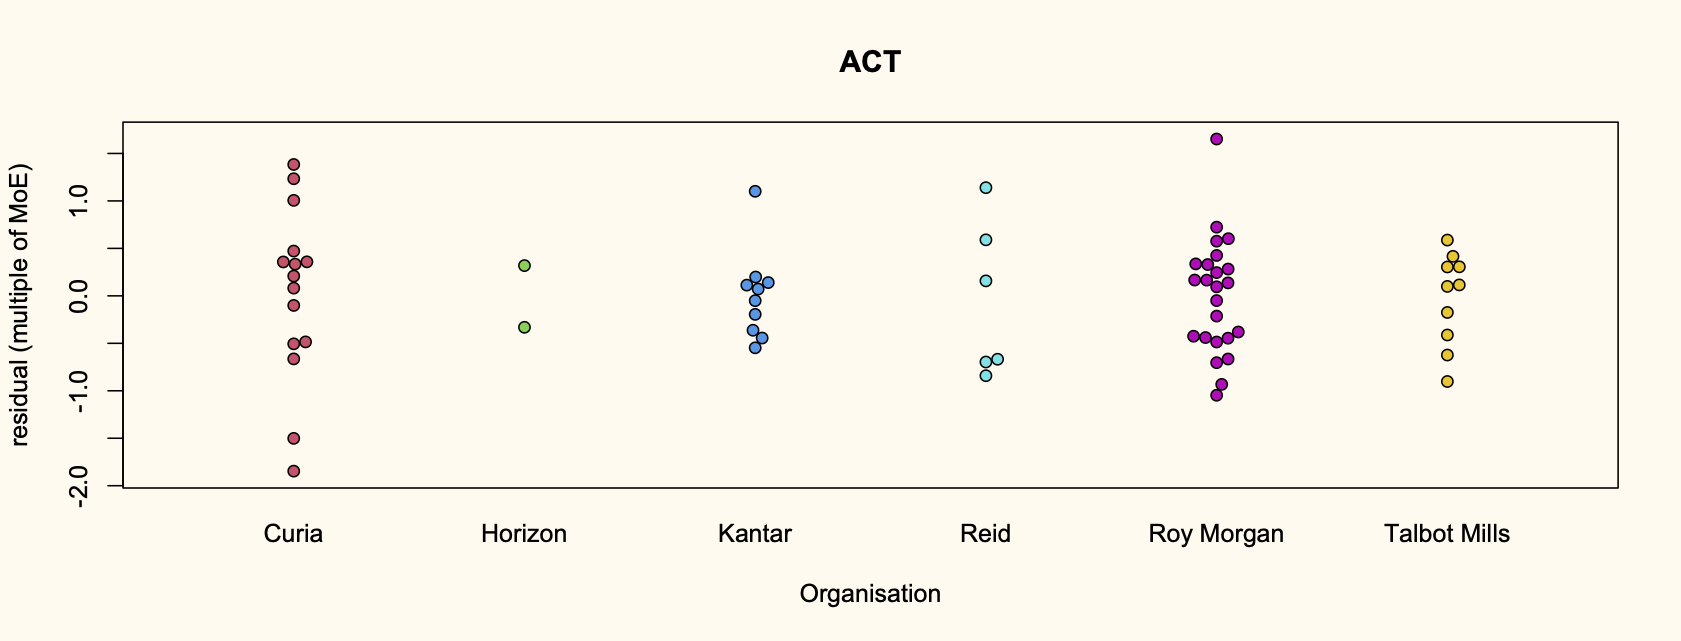
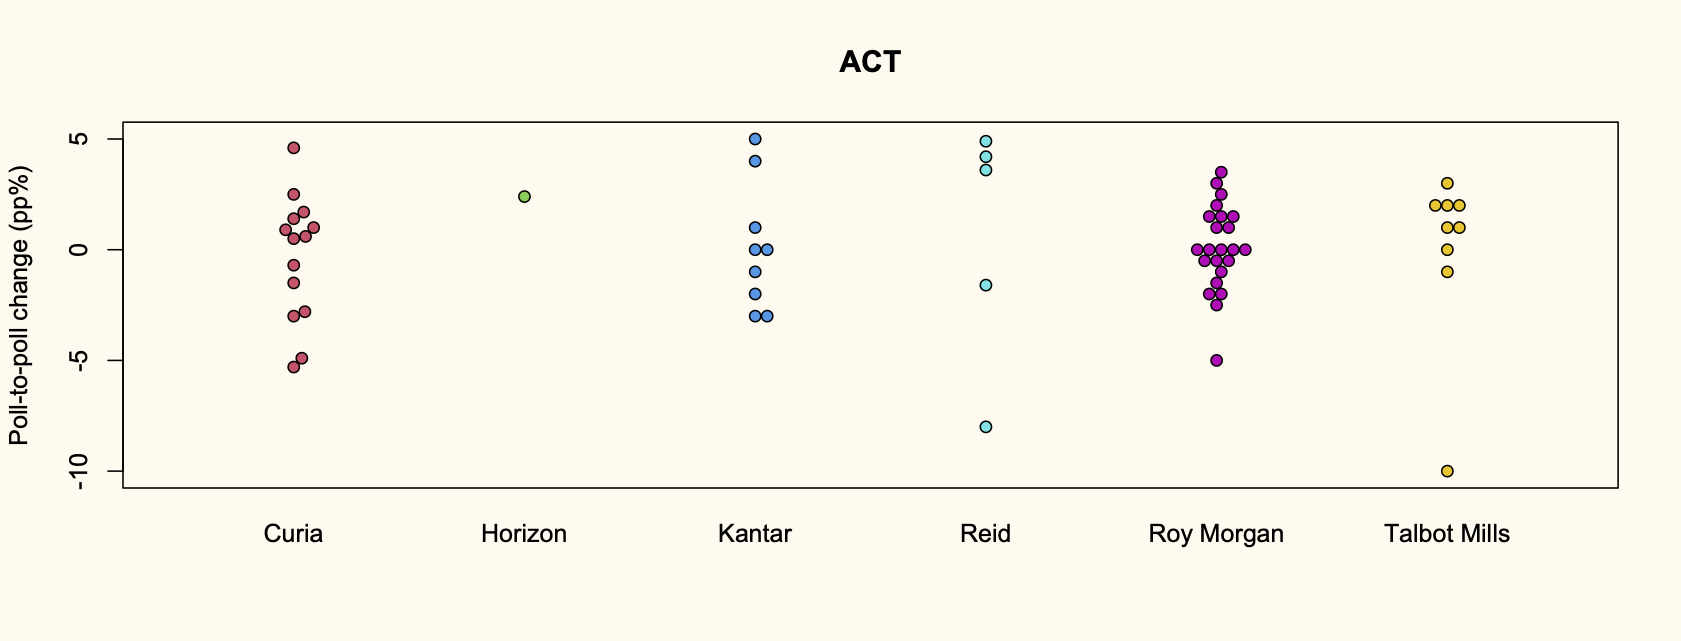
For ACT:
And finally for Labour
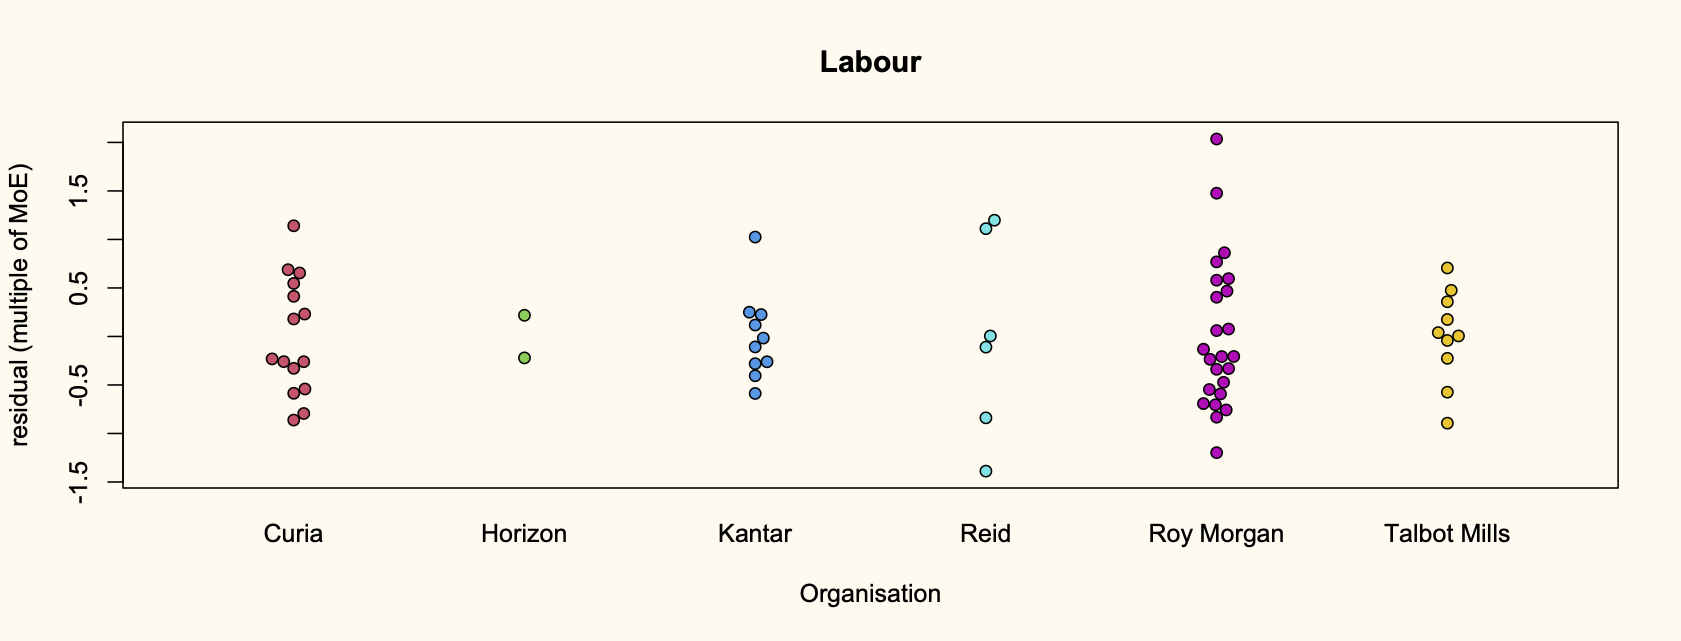
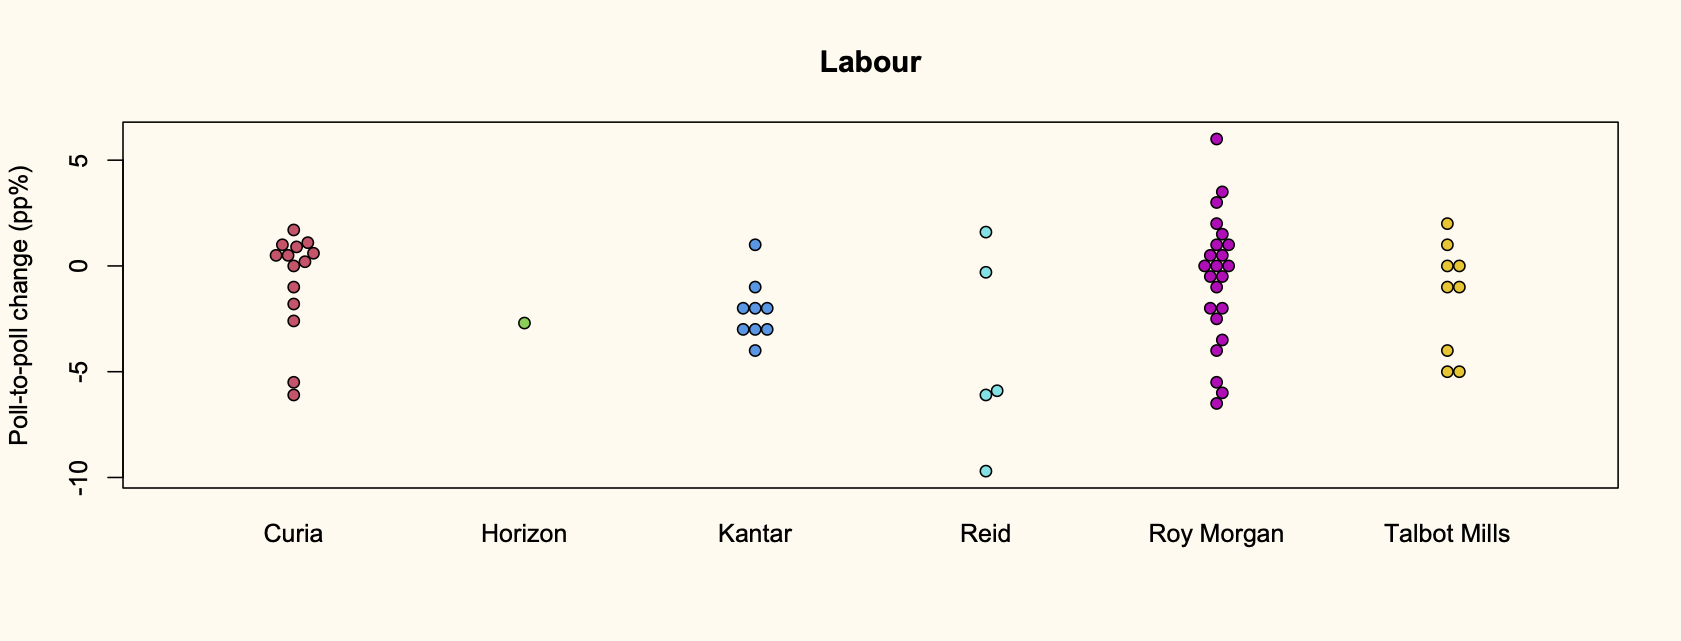
So, it’s complicated. The differences are mostly not huge, but for the Greens and Labour there does seem to be more variability in the Roy Morgan results. For National there isn’t, and probably not for ACT. The Curia polls are also more variable for Green but not for Labour. I think this makes Roy Morgan less weird than people usually say, but there does seem to be something there.
As an additional note, the trend models also confirm that the variance of poll results is about twice what you’d expect from a simple sampling model. This means the margin of error will be about 1.4 times what the pollers traditionally claim: about 4.5% near 50% and about 1% near the MMP threshold of 5%
Thomas Lumley (@tslumley) is Professor of Biostatistics at the University of Auckland. His research interests include semiparametric models, survey sampling, statistical computing, foundations of statistics, and whatever methodological problems his medical collaborators come up with. He also blogs at Biased and Inefficient See all posts by Thomas Lumley »
How do the biases look against time from closest election? There was talk in the USA about companies purposefully biasing results between elections and then not during the election period.
4 years ago