Posts written by Thomas Lumley (2645)

avatar

Thomas Lumley (@tslumley) is Professor of Biostatistics at the University of Auckland. His research interests include semiparametric models, survey sampling, statistical computing, foundations of statistics, and whatever methodological problems his medical collaborators come up with. He also blogs at Biased and Inefficient

October 9, 2015

Predictive analytics and the rise of the machines

Some cautionary tales

  • “I would like to challenge this picture, and ask you to imagine data not as a pristine resource, but as a waste product, a bunch of radioactive, toxic sludge that we don’t know how to handle.” A talk by Maciej Ceglowski
  • How do you measure whether automated decision making ends up discriminating by race, when it doesn’t explicitly use race as an input? Two posts by Cathy O’Neil
  • A computer program that was accidentally trained to discriminate by gender and ethnicity
  • Why modern predictive analytics doesn’t give ‘algorithms’ in the sense of ‘recipes’, by Suresh Venkat (via @ndiakopoulos)

Briefly

  • A 2010 post complaining about a continuing problem: when the media report on scientific papers that the journals haven’t yet made available to scientists.
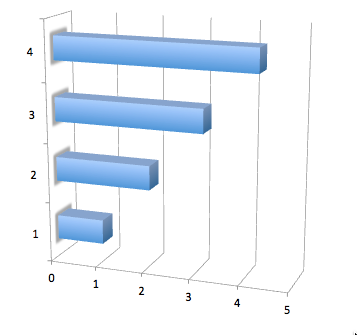
  • Which bar is closest to a whole number in length?xl
    That’s right, the smallest one is exactly 1.0 and the others are all slightly larger than a whole number. Inspired by one of Kieran Healy’s examples
  • Linguistic statistics: G K Chesterton almost never used feminine pronouns in his novels.
  • The famous London Underground map, labelled with rents in the neighbourhood of each station. Would be interesting to see an Auckland map using trains and major bus routes. (via Flowing Data)
October 8, 2015

He’s a lumberjack and he’s inconsistently counted

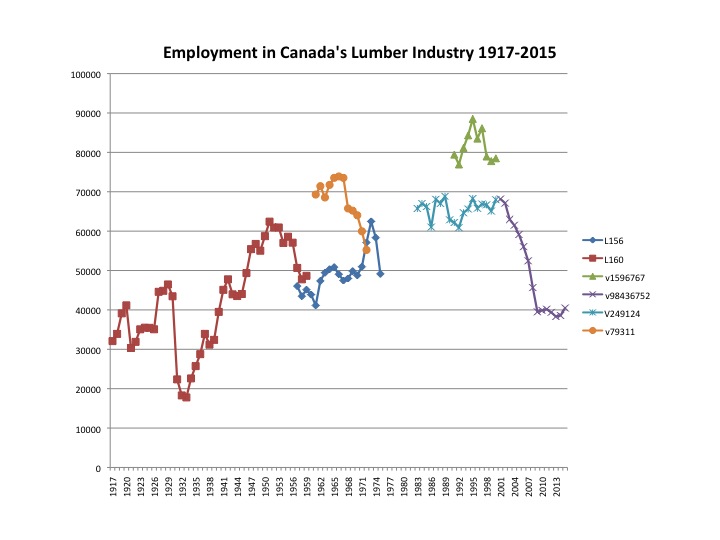
Official statistics agencies publish lots of useful information that gets used by researchers, by educators, by businesses, by journalists, and (with the help of groups like Figure.NZ) by everyone else.  A dilemma for these agencies is how to handle changes in the best ways to measure something. If you never change the definitions you get perfectly consistent reports of no-longer-useful information. If you do change the definitions, things don’t match up.

This graph is from a blog post by a Canadian economist, Liveo Di Matteo. It shows the number of Canadians employed in the lumber industry over time, patched together from several Statistics Canada time series.

6a00d83451688169e201b8d155a38a970c

Dr Di Matteo is a professional, and wasn’t trying to do anything subtle here — he just wanted a lecture slide — and a lot of this data was from the time when Stats Canada was among the best in the world, so it’s not a problem that’s easy to avoid. It’s just harder than it sounds to define who works in the lumber industry. For example, are the log drivers in the lumber industry, or are they something like “transport workers, not elsewhere classified”?


October 6, 2015

When the lack of news is the story

There are new (provisional) suicide figures out for the year to June, and the Herald has a story (and has embedded the summary report).

The problem with news stories on this topic is that the important statistics haven’t changed.  Suicide rates have been pretty much constant over the 9 years of data shown. It’s still true that New Zealand has a high suicide rate, that it’s much higher for men than women, and that it’s much higher for Māori than non-Māori, and lowest for Asians.

There were slightly more suicides this year than in recent years, almost the same per-capita rate as in 2011/12.  Most of the increase was in men, but it’s still not any sort of clear sign of a trend.  The Herald story leads with the changes, as news has to, but the real story is that we still haven’t managed to change anything.

October 5, 2015

Our favourite bogus poll

It’s time for Forest & Bird’s Bird of the Year competition. As with any bogus poll, we won’t learn what the true popularity of the various NZ birds actually is.

kokako_0

As long as it’s clear that bogus polls are being used for entertainment and advertising, not to collect information, there isn’t a statistical problem with them.

October 4, 2015

Psychic meerkats and organic antioxidants

From the Independent, which used to be the sort of paper that knew better:

With a 100 per cent record up to this point – they predicted England would beat Fiji but lose to Wales – it seems that the meerkats might have some genuine psychic abilities. 

Even if they do, that doesn’t explain why they care about rugby, or how they know which flags painted on pebbles correspond to which group of large men.

Yes, I get that it’s not supposed to be true. Simon Rice probably doesn’t believe the meerkats are psychic. He probably doesn’t expect his readers to believe the meerkats are psychic (and if they did, they would have been terribly disappointed). In the old days of paper newspapers though, you could distinguish stories that were supposed to be true from the ones that weren’t supposed to be true by a lot of positioning and formatting cues. 

With the move from paper to digital, the presentation of news stories that are supposed to be true is getting more similar to the presentation of news stories that aren’t supposed to be true.  That’s especially an issue for health science news: even when the reporter knows which stories are news and which are nutribollocks, it can be hard for the reader to tell.


(via)

October 2, 2015

Stay alert for overselling.

From the Daily Mail (via the Herald) “Need a boost? Try orange juice, not coffee“,  reports on a study comparing high-pulp orange juice not to coffee but to orange-flavoured water. The story says

After the real juice they did better on tests of speed and attention and still felt very alert six hours later, the European Journal of Nutrition reports.

The research paper is here (open access, no link).  There were ten tests of speed and attention and mood, each done at two times after the orange juice.   If you chose the most-impressive of the twenty comparisons and pretended it was the only one that mattered, you’d get some reasonable evidence that orange juice gave a slight improvement over fake orange juice. If you take into account the changes in all the measurements it looks much less convincing.  A combined analysis of all the measurements “approached significance,” as people say when they don’t get the hoped-for results.

And “felt very alert six hours later“? That’s a 6% difference between fake and real orange juice on a “how alert do you feel?” scale, plus or minus about 6.4%.

It’s a pity that Pepsi, who sponsored the study and sell the juice, didn’t make it a bit bigger so that any real effects would be convincing and chance fundings would be more clearly too small to worry about.


A gene for headlines?

Under the headline “Studies show food preferences are written in genes,” the Herald has an interesting story by CSIRO scientist Nicholas Archer about genetic variation in taste and smell receptors (and largely not about food preferences). The same story was at The Conversation, under the headline “Blame it on mum and dad: how genes influence what we eat.

The text makes much more reasonable claims about food preference. It says

Food preferences vary and are shaped by three interacting factors: the environment (your health, diet and cultural influences); prior experience; and genes, which alter your sensory perception of foods.

and later

Genetics has also been linked to whole foods, such as coriander preference, coffee liking and many others. But genes have only a small influence on preference for these foods due to their sensory complexity and also the contribution of your environment and prior experiences.

It’s only the headlines that are over the top, but that’s a consistent problem with genetics stories.

When you see a genetics headline, the first thing to think about is whether the trait it talks about has changed over the past century or so. Human genetics hasn’t had time to.

We can look at changes over recent time to show the enormous non-genetic influences on food choice. The biggest ones are due to wealth, but there are actual changes in preferences as well.

For example, raw fish would have been an unusual food preference for Aucklanders of European descent forty years ago. It’s not that raw fish was unavailable back then; that was how it came from the shop. It’s just that people didn’t eat it raw, because ickNow, raw fish is an absolutely routine form of fast food. That’s not because of a change in genetics, it’s because of cultural change spreading from the US.  As another example, many European-ancestry people like spicier food than their parents or grandparents did, not because of a change in genetics, but because of a change in exposure to spices early in life.  You can easily think of more.

“Mum and dad” do have a big influence on what we eat, but most of it happens well after conception.


October 1, 2015

Briefly

  • Algorithm audit and cheating (from NYT): there is a class of software that successfully goes through tight regulatory auditing — it’s not voting machines, it’s gambling machines
  • Book recommendation: How Not To Be Wrong: The Power of Mathematical Thinking, by Jordan Ellenberg. The only thing wrong with this book is that he’s misspelled “Statistical” in the subtitle.
  • Book recommendation: Eureka: Discovering Your Inner Scientist, by Chad Orzel. A good guide to how science actually works; useful for dispelling the myth that scientists are mutant geniuses who do qualitatively different stuff from normal humans.
September 30, 2015

Three strikes: some evidence (updated)

Update: the data Graeme Edgeler was given didn’t mean what he (reasonably) thought they meant and this analysis is no longer operative. There isn’t good evidence that the law has any substantial beneficial effect.  See Nikki Macdonald’s story at Stuff and Graeme’s own post at Public Address.

The usual objection to a “three-strikes” law imposing life sentences without parole, in addition to the objections against severe mandatory minimums, is

  • It doesn’t work; or
  • It doesn’t work well enough given the injustice involved; or
  • There isn’t good enough evidence that it works well enough given the potential for injustice involved.

New Zealand’s version of the law is much less bad than the US versions, but there are still both real problems, and theoretical problems (robbery and aggravated burglary both include crimes of a wide range of severity).

Graeme Edgeler (who is not an enthusiast for the law) has a post at Public Address arguing that there is, at least, evidence of a reduction in subsequent offending by people who receive a first-strike warning, based a mixture of published data and OIA requests.

Here’s his data in tabular form, showing second convictions for offences that would qualify under the three-strikes law. The red cell is ‘first strike’ convictions, the other rows did not count as strikes because the law isn’t retrospective.

Offence Conviction Number Second conviction Number
7/05-6/10 7/05-6/10 6809 7/05-6/10 256
Before 7/10 7/10-6/15 2437 7/10-1/15 300
7/10-6/15 7/10-6/15 5422 7/10-6/15 81


The first and last rows are directly comparable five-year periods. Offences that now qualify as ‘strikes’ are down 20% in the last five-year period; second convictions are down a further 62%. Data in the middle row isn’t as comparable, but there is at least no apparent support for a general reduction in reoffending in the last five-year period.

The overall 20% decrease could easily be explained as part of the long-term trends in crime, but the extra decrease in second-strike offences can’t be.  It’s also much larger than could be expected from random variation. The law isn’t keeping violent criminals off the streets, but it does seem to be deterring second offences.

Reasonable people could still oppose the three-strikes law (and Graeme does) but unless we have testable alternative explanations for the large, selective decrease, we should probably be looking at arguments that the law is wrong in principle, not that it’s ineffective.