Posts written by Thomas Lumley (2645)

avatar

Thomas Lumley (@tslumley) is Professor of Biostatistics at the University of Auckland. His research interests include semiparametric models, survey sampling, statistical computing, foundations of statistics, and whatever methodological problems his medical collaborators come up with. He also blogs at Biased and Inefficient

August 13, 2014

When are self-selected samples worth discussing?

From recent weeks, three examples of claims from self-selected samples:

In all three cases, you’d expect the pattern to generalise to some extent, but not quantitatively. The dating site in question specifically boasts about the non-representativeness of its members; the NZAS survey was sent to people who’d be likely to care, and there wasn’t much time to respond; scientists who had experienced or witnessed harassment would be more likely to respond and to pass the survey along to others.

I think two of these are worth presenting and discussing, and the other one isn’t, and that’s not just because two of them agree with my political prejudices.

The key question to ask when looking at this sort of probably non-representative sample, is whether the response you see would still be interesting if no-one outside the sample shared it. That is, the surveys tell us at a minimum

  • there exist 350 women in New Zealand who wouldn’t marry a man earning less than them, and are prepared to say so
  • there exist 200-odd scientists in NZ who think the National Science Challenges were badly chosen or conducted, and are prepared to say so
  • there exist 417 scientists who have experienced verbal sexual harassment, and 139 who have experienced unwanted physical contact from other research staff during fieldwork, and are prepared to say so.

I would argue that the first of these is completely uninteresting, but the second is contrary to the impressions being given by the government, and the third should worry scientists who participate in or organise fieldwork.
 

August 9, 2014

Briefly

Limits of measurement edition

  • “So you can either believe that Germany has no billionaires or that European statisticians aren’t very good at finding them.” Stories from Slate and Bloomberg on the difficulty of estimating wealth inequality
  • “Big data really only has one unalloyed success on its track record, and it’s an old one: Google, specifically its Web search.” Another story from Slate, on Big Data and creepy experiments.
  • Even for the best drink-driving propaganda, such as the famous ‘Ghost Chips’ ad, the evaluation is basically in terms of public perception, because it’s too hard to evaluate actual impact on drink driving.  A nice piece from TheWireless
August 8, 2014

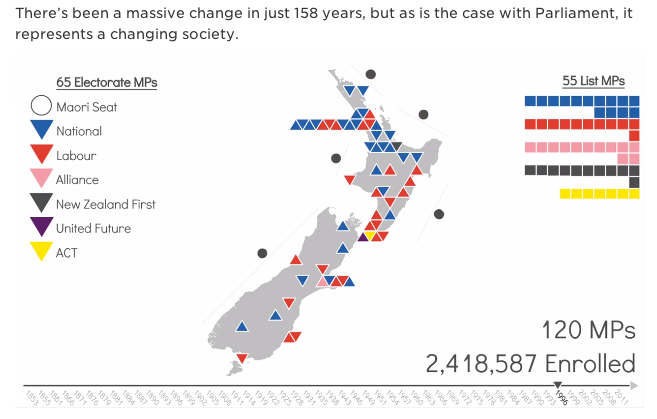
History of NZ Parliament visualisation

One frame of a video showing NZ party representation in Parliament over time,

nzparties

made by Stella Blake-Kelly for TheWireless. Watch (and read) the whole thing.

August 7, 2014

Vitamin D context

There’s a story in the Herald about Alzheimer’s Disease risk being much higher in people with low vitamin D levels in their blood. This is observational data, where vitamin D was measured and the researchers then waited to see who would get dementia. That’s all in the story, and the problems aren’t the Herald’s fault.

The lead author of the research paper is quoted as saying

“Clinical trials are now needed to establish whether eating foods such as oily fish or taking vitamin D supplements can delay or even prevent the onset of Alzheimer’s disease and dementia.”

That’s true, as far as it goes, but you might have expected the person writing the press release to mention the existing randomised trial evidence.

The Women’s Health Initiative, one of the largest and probably the most expensive randomised trial ever, included randomisation to calcium and vitamin D or placebo. The goal was to look at prevention of fractures, with prevention of colon cancer as a secondary question, but they have data on dementia and they have published it

During a mean follow-up of 7.8 years, 39 participants in the treatment group and 37 in the placebo group developed incident dementia (hazard ratio (HR) = 1.11, 95% confidence interval (CI) = 0.71-1.74, P = .64). Likewise, 98 treatment participants and 108 placebo participants developed incident [mild cognitive impairment] (HR = 0.95, 95% CI = 0.72-1.25, P = .72). There were no significant differences in incident dementia or [mild cognitive impairment] or in global or domain-specific cognitive function between groups.

That’s based on roughly 2000 women in each treatment group.

The Women’s Health Initiative data doesn’t nail down all the possibilities. It could be that a higher dose is needed. It could be that the women were too healthy (although half of them had low vitamin D levels by usual criteria). The research paper mentions the Women’s Health Initiative and these possible explanations, so the authors were definitely aware of them.

If you’re going to tell people about a potential way to prevent dementia, it would be helpful to at least mention that one form of it has been tried and didn’t work.

Non-bogus non-random polling

As you know, one of the public services StatsChat provides is whingeing about bogus polls in the media, at least when they are used to anchor stories rather than just being decorative widgets on the webpage. This attitude doesn’t (or doesn’t necessarily) apply to polls that make no effort to collect a non-random sample but do make serious efforts to reduce bias by modelling the data. Personally, I think it would be better to apply these modelling techniques on top of standard sampling approaches, but that might not be feasible. You can’t do everything.

I’ve been prompted to write this by seeing Andrew Gelman and David Rothschild’s reasonable and measured response (and also Andrew’s later reasonable and less measured response) to a statement from the American Association for Public Opinion Research.  The AAPOR said

This week, the New York Times and CBS News published a story using, in part, information from a non-probability, opt-in survey sparking concern among many in the polling community. In general, these methods have little grounding in theory and the results can vary widely based on the particular method used. While little information about the methodology accompanied the story, a high level overview of the methodology was posted subsequently on the polling vendor’s website. Unfortunately, due perhaps in part to the novelty of the approach used, many of the details required to honestly assess the methodology remain undisclosed.

As the responses make clear, the accusation about transparency of methods is unfounded. The accusation about theoretical grounding is the pot calling the kettle black.  Standard survey sampling theory is one of my areas of research. I’m currently writing the second edition of a textbook on it. I know about its grounding in theory.

The classical theory applies to most of my applied sampling work, which tends to involve sampling specimen tubes from freezers. The theoretical grounding does not apply when there is massive non-response, as in all political polling. It is an empirical observation based on election results that carefully-done quota samples and reweighted probability samples of telephones give pretty good estimates of public opinion. There is no mathematical guarantee.

Since classical approaches to opinion polling work despite massive non-response, it’s reasonable to expect that modelling-based approaches to non-probability data will also work, and reasonable to hope that they might even work better (given sufficient data and careful modelling). Whether they do work better is an empirical question, but these model-based approaches aren’t a flashy new fad. Rod Little, who pioneered the methods AAPOR is objecting to, did so nearly twenty years before his stint as Chief Scientist at the US Census Bureau, an institution not known for its obsession with the latest fashions.

In some settings modelling may not be feasible because of a lack of population data. In a few settings non-response is not a problem. Neither of those applies in US political polling. It’s disturbing when the president of one of the largest opinion-polling organisations argues that model-based approaches should not be referenced in the media, and that’s even before considering some of the disparaging language being used.

“Don’t try this at home” might have been a reasonable warning to pollers without access to someone like Andrew Gelman. “Don’t try this in the New York Times” wasn’t.

New breast cancer gene

The Herald has a pretty good story about a gene, PALB2, where there are mutations that cause a substantially raised risk of breast cancer.  It’s not as novel as the story implies (the first sentence of the abstract is “Germline loss-of-function mutations in PALB2 are known to confer a predisposition to breast cancer.”), but the quantified increase in risk is new and potentially a useful thing to know.

Genetic testing for BRCA mutations is funded in NZ for people with a sufficiently strong family history, but the policy is to test one of the affected relatives first. This new gene demonstrates why.

If you had a high-risk family history of breast cancer, and tested negative for BRCA1 and BRCA2 mutations, you might assume you had missed out on the bad gene. It’s possible, though, that your family’s risk was due to some other mutation — in PALB2, or in another undiscovered gene — and in that case the negative test didn’t actually tell you anything. By testing a family member  first, you can be sure you are looking in the right place for your risks, rather than just in the place that’s easiest to test.

August 6, 2014

With friends like these…

Via Alberto Cairo on Twitter, a picture from an introductory statistics text being sold at the big statistics conference in Boston this week

BuTiYZtIcAAaju0

Income statistics

The Herald has a story headlined “Where to work if it’s money you’re after,” giving estimated median incomes across a range of job areas.  Sadly, if you read to the end, two of the sources are summaries of advertised salaries for advertised jobs on Seek and TradeMe.  That is, they are neither actual incomes, nor for the country as a whole.

Rather than just whinge about unrepresentative data, I looked at StatsNZ. They divide things up differently, so there was only one job group in the story that exactly matched one on NZ.Stat. People working in construction have a median weekly income of $840 and mean weekly income of $956 according to the NZ Income Survey. If most people in construction worked all year, without periods of unemployment, this would come to a median annual income of  $43,680 or a mean of $49,712.

The Herald thinks the median annual income in construction is $60,000-$78,000.


August 4, 2014

Predicting blood alcohol concentration is tricky

Rasmus Bååth, who is doing a PhD in Cognitive Science, in Sweden, has written a web app that predicts blood alcohol concentrations using reasonably sophisticated equations from the forensic science literature.

The web page gives a picture of the whole BAC curve over time, but requires a lot of detailed inputs. Some of these are things you could know accurately: your height and weight, exactly when you had each drink and what it was. Some of them you have a reasonable idea about: is your stomach empty or full, and therefore is alcohol absorption fast or slow. You also need to specify an alcohol elimination rate, which he says averages 0.018%/hour but could be half or twice that, and you have no real clue.

If you play around with the interactive controls, you can see why the advice given along with the new legal limits is so approximate (as Campbell Live is demonstrating tonight).  Rasmus has all sorts of disclaimers about how you shouldn’t rely on the app, so he’d probably be happier if you don’t do any more than that with it.

August 2, 2014

When in doubt, randomise

The Cochrane Collaboration, the massive global conspiracy to summarise and make available the results of clinical trials, has developed ‘Plain Language Summaries‘ to make the results easier to understand (they hope).

There’s nothing terribly noticeable about a plain-language initiative; they happen all the time.  What is unusual is that the Cochrane Collaboration tested the plain-language summaries in a randomised comparison to the old format. The abstract of their research paper (not, alas, itself a plain-language summary) says

With the new PLS, more participants understood the benefits and harms and quality of evidence (53% vs. 18%, P < 0.001); more answered each of the five questions correctly (P ≤ 0.001 for four questions); and they answered more questions correctly, median 3 (interquartile range [IQR]: 1–4) vs. 1 (IQR: 0–1), P < 0.001). Better understanding was independent of education level. More participants found information in the new PLS reliable, easy to find, easy to understand, and presented in a way that helped make decisions. Overall, participants preferred the new PLS.

That is, it worked. More importantly, they know it worked.