Posts written by Thomas Lumley (2645)

avatar

Thomas Lumley (@tslumley) is Professor of Biostatistics at the University of Auckland. His research interests include semiparametric models, survey sampling, statistical computing, foundations of statistics, and whatever methodological problems his medical collaborators come up with. He also blogs at Biased and Inefficient

August 16, 2013

Collateral damage

There’s a long tradition in law and ethics of thinking about how much harm to the innocent should be permitted in judicial procedures, and at what cost. The decision involves both uncertainty, since any judicial process will make mistakes, and consideration of what the tradeoffs would be in the absence of uncertainty. An old example of the latter is the story of Abraham bargaining with God over how many righteous people there would have to be in the notorious city of Sodom to save it from destruction, from a starting point of 50 down to a final offer of 10.

With the proposed new child protection laws, though, the arguments have mostly been about the uncertainty.  The bills have not been released yet, but Paula Bennett says they will provide for protection orders keeping people away from children, to be imposed by judges not only on those convicted of child abuse but also ‘on the balance of probabilities’ for some people suspected of being a serious risk.

We’ve had two stat-of-the-week nominations for a blog post about this topic (arguably not ‘in the NZ media’, but we’ll leave that for the competition moderator). The question at issue is how many innocent people would end up under child protection orders if 80 orders were imposed each year.

The ‘balance of probabilities’ standard theoretically says that an order can be imposed (?must be imposed) if the probability of being a serious risk is more than 50%.  The probability could be much higher than 50% — for example, if you were asked to decide on the balance of probabilities which of your friends are male, you will usually also be certain beyond reasonable doubt for most of them.  On the other hand, there wouldn’t be any point to the legislation unless it is applied mostly to people for whom the evidence isn’t good enough even to attempt prosecution under current law, so the typical probabilities shouldn’t be that high.

Even if we knew the distribution of probabilities, we still don’t have enough information to know how many innocent people will be subject to orders. The probability threshold here is the personal partly-subjective uncertainty of the judge, so even if we had an exact probability we’d only know how many innocent people the judge thought would be affected, and there’s no guarantee that judges have well-calibrated subjective probabilities on this topic.

In fact, the judicial system usually rules out statistical prior information about how likely different broad groups of people are to be guilty, so the judge may well be using a probability distribution that is deliberately mis-calibrated.  In particular, the judicial system is (for very good but non-statistical reasons) very resistant to using as evidence the fact that someone has been charged, even though people who have been charged are statistically much more likely to be guilty than random members of the population.

At one extreme, if the police were always right when they suspected people, everyone who turned up in court with any significant evidence against them would be guilty.  Even if the evidence was only up to the balance of probabilities standard, it would then turn out that no innocent people would be subject to the orders. That’s the impression that Ms Bennett seems to be trying to give — that it’s just the rules of evidence, not any real doubt about guilt.  At the other extreme, if the police were just hauling in random people off the street, nearly everyone who looked guilty on the balance of probabilities might actually just be a victim of coincidence and circumstance.

So, there really isn’t an a priori mathematical answer to the question of how many innocent people will be affected, and there isn’t going to be a good way to estimate it afterwards either. It will be somewhere between 0% and 100% of the orders that are imposed, and reasonable people with different beliefs about the police and the courts can have different expectations.
August 15, 2013

Big Data on Radio NZ Nights

Dr Mark Apperley, from Uni of Waikato, with Phil O’Brien

“Big Data” isn’t just big, it’s unstructured.

(via Kate Hannah)

August 14, 2013

Different colours, one people?

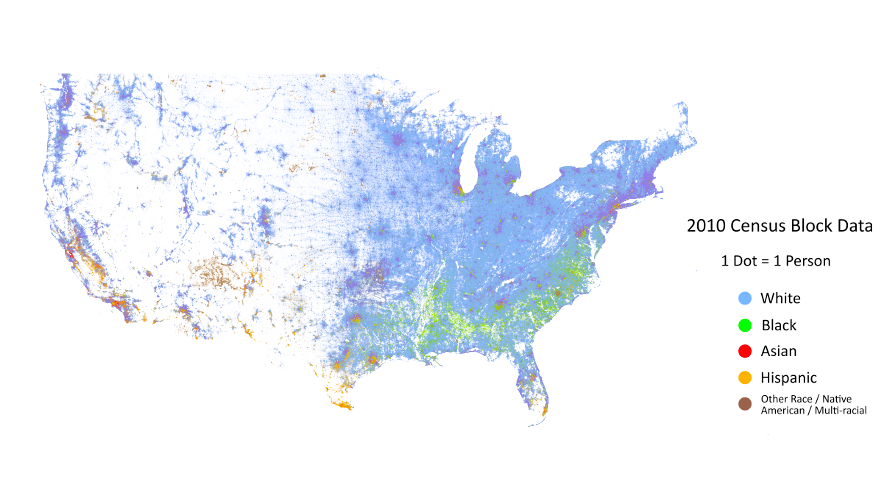
A beautiful map from the Cooper Center for Demographics at the University of Virginia, showing 300 million dots, one for each person in the United States, coloured by the census-reported race/ethnicity categories.

usmap


As we’ve pointed out before, the most obvious feature in the map is the change in population density across the north-south ‘dry line’, but it’s the other features that are of most interest. The larger black population across the south-east, and the greater diversity of the cities are obvious.

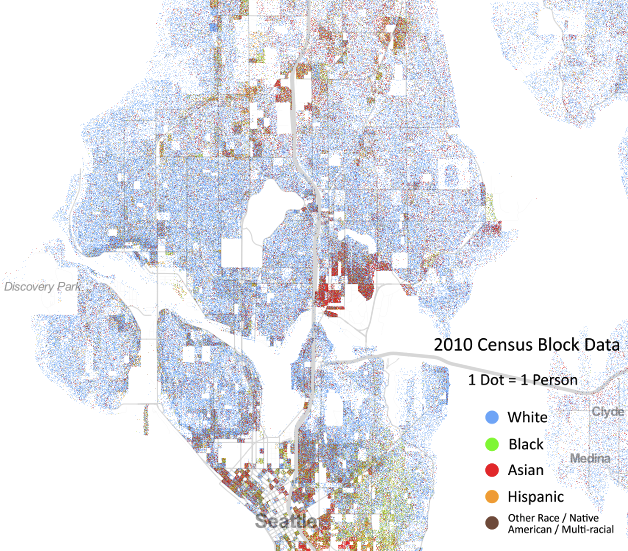
There’s also a zoomable version of the map for you to explore.  Here’s part of Seattle, where I used to live, which is the purple splotch at the top left of the whole-US map

seattle-map


At this smaller scale there’s a lot more clumping by race, with black and Hispanic people living at the top and bottom of the map. Oh, and that odd-shaped spot in the middle? That’s the University of Washington, so those are university students.

(via Luis Apiolaza on Twitter)

August 13, 2013

Cancer causes?

Today Stuff tells us that talcum powder, dogs, barbecues, fish oil, oral sex, and air travel cause cancer.  The statistic on dogs is especially bizarre

Analysis of breast cancer cases by researchers at the University of Munich showed that 79.7 per cent of all breast cancer patients had regular contact with dogs before diagnosis. Only 4.4 per cent of the patients did not have pets at any time, compared to 57.3 per cent of a healthy control group. According to researchers, that’s a 29-fold increased risk for pet owners.

Given that the lifetime risk of breast cancer is roughly 10%, a 29-fold increase seems a bit improbable. That’s more than the increase in lung cancer risk caused by smoking, for example.

It’s interesting to track this one down. An obvious place to start is the “Kill or Cure?” website that collects Daily Mail stories about cancer.  Back in 2007, the Mail reported what looks like the same story

Both dogs and humans carry the same virus that can induce cancer

Analysis of breast cancer cases by researchers at the University of Munich showed that patients with this type of cancer were significantly more likely to have kept a dog than a cat.

In fact, 79.7 per cent of all patients had intensive contact with dogs before they were diagnosed.

Only 4.4 per cent of the patients did not have pets at any time compared to 57.3 per cent of a healthy control group ? so there was a 29-fold increased risk for pet owners.

They didn’t link either, but the story looks like it comes from this publication (and if you can get to the full-text article you find that the numbers match).

The first thing to note is that the journal is Medical Hypotheses, notoriously “intended as a forum for unconventional ideas without the traditional filter of scientific peer review,

The second thing to note is the relative risk given in the abstract: 3.5, not 29.  The number ’29’ does appear later in the paper, but even the authors aren’t prepared to defend it much.

The third thing to notice is what comparison was actually done

 It became apparent that patients with breast carcinoma (N=69) owned significantly more often dogs but not cats compared to age matched female controls. We compared the frequencies of dog and pet ownership with data from public available statistics on women (N=1320) of the same age group in Bavaria.

That is, they asked a small number of patients with breast cancer about close contact with dogs, but used public statistics on pet ownership for the controls.  Using different methods of obtaining information in cases and controls is a notorious way to come up with spurious results.

The theory was that dogs and humans shared a virus that caused breast cancer.  There have been some reports of finding genetic material that looks like this virus in breast tumours, but other reports that did not, including an Australian research paper that looked very carefully.

Some more graphics links

  • Subtleties of Color (parts 1, 2, 3) on choosing colour palettes for different types of graphic
  • Dear NASA, No more rainbow color scales, please.
  • The Colour Oracle runs a colour filter on your whole screen to show the impact of the three sorts of dichromatic colour vision. Now it’s easy to avoid graphs that are invisible to some of your audience.
  • “Standards of statistical presentation”, originally published in 1966 by the US Army, and containing a lot of what StatsChat covers.  This isn’t cutting edge stuff, people.
August 12, 2013

Shocked (shocked!) by rate increases.

Nathaniel Wilson nominates a Stat of the Week that I’d noticed this morning but hadn’t had time to write up.

The Herald story begins

Aucklanders’ rates bills have arrived in letterboxes and the figures have come as a shock to some homeowers who have seen rises of 10 per cent – despite the council promising an average increase of 2.9 per cent.

Obviously there’s nothing inconsistent about the average being 2.9% and the maximum being 10%.  NZ’s average income is about $48000, but I take home somewhat more than that, and the CEO of Fonterra makes a whole lot more, and he may well not be the maximum. The average and the maximum are different. That’s not a shock.

The other point, that our nominator doesn’t make, is that rate increases are capped at 10%, and that all the people who hit the cap last year already knew that they would be seeing an increase this year, and roughly how much it would be. I know this because I live in Onehunga, where property values have gone up quite a lot, and I’m one of the people with a large rate increase. Since I read the rates notice I received last year I’m not at all shocked. I don’t have to say whether I’m happy or not, but it certainly wasn’t a surprise.


August 11, 2013

Chilean census problems

A neat bit of snark from the New York Times

“I humbly apologize to Chileans for those mistakes,” Mr. Piñera said in a statement Thursday. “When I was informed of these errors, I felt as upset and outraged as millions of Chileans throughout the country.”

It is not clear, however, how many millions of Chileans there are.

Last year, the Chilean census went from a one-day event run by volunteers to a much more ambitious operation taking months, but missing a lot more people — the census review commission (PDF, Spanish)estimates that more than 9% were missed. Worse, based on the projections from other data, the proportion of people missed seems to have varied by age and gender (and so presumably by other factors as well).  The review commission recommended using the data as little as possible, and trying to run a new census in 2015 for a subset of the information. For the next full census, in 2022, they recommended using adminstrative records, online forms, and other approaches to reduce the need to visit every household in person.

The commission also had fairly strong recommendations about the national statistical office

se estima indispensable que el INE fortalezca sus competencias, recursos, atribuciones y niveles de autonomía para que se convierta en una oficina de estadísticas de excelencia, propia del nivel de desarrollo que ha logrado el país. también se requiere que sea una institución abierta al escrutinio público, disponible para la participación de otras instancias públicas y privadas en las actividades que les competan, y que las estadísticas producidas se transformen en bienes públicos (las bases de datos y documentación asociada estén disponibles a todo público sin cargos financieros y en forma expedita, bajo los resguardos de confidencialidad necesarios).

or in English, that they improve their skills, resources, and competencies; become more transparent and independent; and make results publicly available for free in a useful format.

This is probably worse than the Canadian census debacle, though at least this one wasn’t deliberate. 

(via Luis Apiolaza)

Advances in non-representative sampling

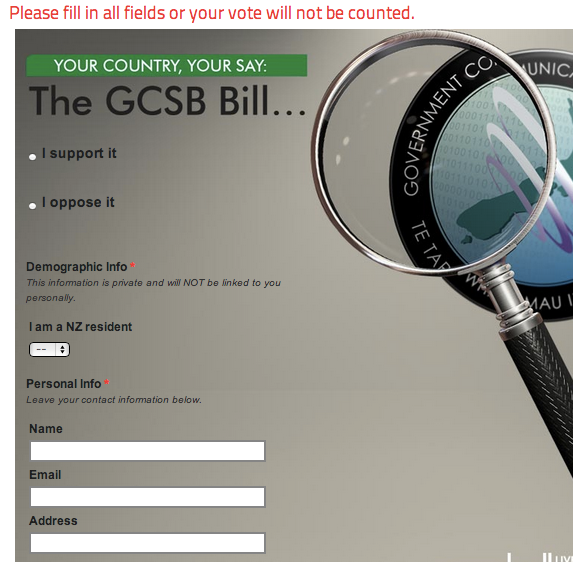
My attention has been drawn (by Joseph Simpson, on Twitter) to the Campbell Live online poll on the GCBSB vote.  These polls are fairly bogus anyway, being collected from self-selected viewers or readers, but in this case there’s an added twist.

In red at the top “Please fill in all fields or your vote will not be counted.”  The fields include name, email, and address.  Wouldn’t you expect that people unhappy with the prospect of increased (legal) surveillance of New Zealanders might be less willing to give all their personal details with their vote?

vote
To be fair, the form says that the personal information is private and won’t be linked to you personally.  If we assume don’t mean this, but actually mean that the personal information won’t be linked to the votes, and that TV3 is able to ensure this, there’s no problem.

The wine when it is red

An NZ wine maker has produced wines with high levels of the chemical resveratrol. In Stuff’s story

“We can’t say that alcohol is healthy, but we can say resveratrol is,” co-director Kathleen Corsbie said.

Actually, the evidence for health benefits of lowish levels of alcohol consumption compared to none is much, much stronger than the evidence for any benefit of resveratrol, because resveratrol is almost unstudied in human disease.

Stuff’s story is well done, with useful background and expert commentary, eg,

The French, who eat fatty foods such as cheese and pate and also drink a lot of red wine, are the most commonly used example, Holt said.

“They have one of the lower rates of heart disease.”

But saying the wine will protect drinkers against cancer and other diseases is an exaggeration, Holt said.

It’s a respectable, though far from proven, hypothesis that resveratrol has some part in lower French rates of heart disease, but as he points out, that’s not true for cancer (the French actually don’t have low cancer rates compared to the rest of Europe, for example).

If you go to the Southern Wines website, you find more detail about their claim

The human body uses many complex biochemical pathways and reactions to function; but these reactions result in waste products such as free radicals (molecular compounds that contain an extra unpaired electron). These free radicals are the body’s terrorists and cause biological havoc which helps contribute to our degenerative ongoing diseases such as cancer, dementia, diabetes, vascular disease (heart attack and stroke), macular degeneration (most common cause of blindness in people over 65) and arthritis.

So, they are claiming a reduction in a large collection of aging-related diseases, based on anti-oxidant effects.  In this context it’s useful to note that while there have been no large studies of resveratrol in humans, there have been large randomised trials of anti-oxidant vitamins (beta-carotene, vitamin C, vitamin E) that have, by and large, not found benefits.  For cancer, they have sometimes even found harm, perhaps because free radicals are an important part of the immune system’s armory.

This is the sort of case that makes setting advertising standards tricky.  There’s no question that resveratrol is an antioxidant.  Presumably the manufacturer knows how much resveratrol is in their wine, though saying it’s “40 times higher” as they do is harder to defend given the more-than-20-fold range in resveratrol concentrations in regular red wines (PDF).  There’s moderate evidence that resveratrol is good for lab animals. In humans, almost nothing is known directly — there’s slight evidence for reductions in some heart disease risk factors — but there’s strong evidence that some other antioxidants don’t have large benefits.

Southern Wines co-director is quoted as saying

“One glass of our Balancing Act wine is equivalent to consuming the resveratrol contained in around 40 glasses of normal wine, so why would you drink anything else?”

As with chocolate, the StatsChat advice would be that if you are drinking wine primarily for the health benefit, you’re doing it wrong.

August 10, 2013

Briefly

  • If you’re going to write a story about one of Satoshi Kanazawa’s publications, you might try Googling him first. (The fact that he lived in ChCh for a year is not the most salient piece of his background)
  • The Daily Mail has been publishing a few interesting science stories recently. Apparently not writing them, though.
  • Nate Silver talked to thousands of statisticians at the Joint Statistical Meetings in Montreal this week, about principles for data-based journalism