Posts written by Thomas Lumley (2645)

avatar

Thomas Lumley (@tslumley) is Professor of Biostatistics at the University of Auckland. His research interests include semiparametric models, survey sampling, statistical computing, foundations of statistics, and whatever methodological problems his medical collaborators come up with. He also blogs at Biased and Inefficient

May 15, 2013

You can’t trust those folks

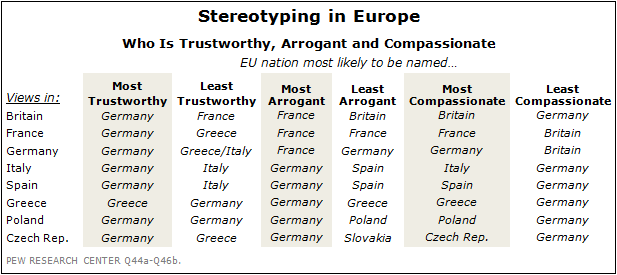
Pew Research have released a report on public opinion in Europe. There’s lots of important stuff in there about austerity, the Euro, unemployment, inequality, and so on.  There’s also this entertaining table:

2013-EU-12


As Robert Burns didn’t quite write: O wad some Pew’R the giftie gie us, To see oursels as ithers see us!

May 14, 2013

Open data: new continents

Two new(ish) Open Data sites are being developed, for Africa and Latin America

These are both in development. The majority of data on the Africa site at the moment is from Kenya; the Latin America site currently has data from Argentina, Chile, Bolivia, and a few others, though nothing from Brazil.

The Latin America site is explicitly focused on the potential for open data to improve government accountability; the Africa site seems to emphasize archiving and access to data. Both are sponsored by the World Bank and have involvement from local journalism.

Dementia: sugar or iPads?

I’ve got no objection to speculative or controversial research being in the media, as long as it’s marked as such, which it often isn’t.

In September, the Herald told us researchers were finding that dementia was due to high blood sugar, essentially a diet and exercise problem.

Today we learn that it’s actually ‘technology’ that causes dementia, in a, like, totally interconnected way

“Considering the changes over the last 30 years – the explosion in electronic devices, rises in background non-ionising radiation – PCs, microwaves, TVs, mobile phones; road and air transport up four-fold increasing background petro-chemical pollution; chemical additives to food, et cetera,” Professor Pritchard said.

“There is no one factor rather the likely interaction between all these environmental triggers, reflecting changes in other conditions.”

What actual research paper found is that the ratio of  diagnoses of neurological diseases  to deaths had risen, across 16 countries, indicating that people live longer after diagnosis.  This could be due to earlier onset, the explanation Prof. Pritchard gives, but they actually don’t do any correction for changes in diagnosis.  Earlier diagnosis could just mean earlier diagnosis, not earlier onset of disease.  Changes in how deaths are classified could also have played a part, although these are less likely to be consistent across countries.

The research paper makes a lot of the fact that dementia in women increased later than in men, attributing this to women entering the workforce and getting exposed to more scary modern stuff (without any actual data on the relative exposure to modern stuff in the workplace and at home).  Surely another possible explanation is that in the modern world, loss of memory and cognitive function is taken seriously in elderly women, but that 30 years ago it just wasn’t regarded as a medical problem.

Survey-manufactured news

A familiar topic on StatsChat is the use of surveys (of widely varying quality) purely to create a press release, in the hope of getting some free product placement from overworked journalists.  The UK blog Ministry of Truth has a detailed look at a company that seems to specialise in this form of marketing

If you didn’t see it on the BBC, then you may well have caught up with the story via the Daily Mail, the Daily Mirror or the Yorkshire Evening Post. In a sense, it doesn’t really matter where you saw the story because they were all churned from the same press release, which had been put out by a  Gloucester-based PR agency called 10 Yetis, and they all, to varying degrees of cut and paste, uncritially reported at least some of the contents of the press release.

It is also, as you may also have already guessed, a complete and utter load of bullshit from start to finish, and that’s really what this particular article is all about.


May 13, 2013

Your guess is as good as ours

There’s currently discussion in NZ about whether to change the 5-yearly census.  North America is providing some examples of what not to do.

Canada decided a while back that they were going to chop most of the questions off the census and put them in a new survey.  The new survey is still sent to everyone, but is voluntary — the worst of both worlds, since a much smaller survey would allow for more effort per respondent in follow-up. Frances Woolley compares the race/ethnicity data from the 2006 Census and the new survey: the survey is dramatically overcounting minorities.

In the USA, a Republican congressman has proposed a bill that would stop the Department of Commerce and the Census Bureau from collecting basically anything other than the census.  That would wipe out the American Community Survey, the detailed 1%/year sample that provides a wide range of regional data. It would also wipe out the Current Population Survey, used to estimate the unemployment rate.  Fortunately for the US economy, there’s no chance of this bill becoming law: the business community hates it, and Senate will never pass it.  It’s still worrying that there’s a public-opinion advantage in pretending you want to abolish the government’s economic data collection.

May 12, 2013

Briefly

A simple exercise with numbers

Stuff has a headline Shoplifters cost $1b as staff theft soars“.  Let’s think about what we would need to know to interpret this number, and what we actually get told.

First, we note that nowhere in the story is there any evidence or informed opinion presented that staff theft has increased, just that it is high.  Also,  the $1 billion figure is fairly weak — the Retailers Association of New Zealand estimates $2 million per day, which is rounded up to $750 million per year, and then to ‘up to $1 billion’.

We don’t get told how this number is estimated: is it actual reports of theft, or imbalances between stock bought and stock sold, or just a impression from the retailers? Is it based on a representative survey, on informed opinion, or on some sort of bogus poll?  Is the cost based on actual wholesale costs paid by the retailer or is it inflated to include the anticipated retail price if the stuff had been sold? Does it include all retailers, or just members of the Retailers Association of New Zealand? Don’t wholesalers also have this problem?  We might hope that the Retailers Association website had some more details, but its press release and media log pages only go up to May 1.

If we were to stipulate the number for the purposes of analysis, does it sound plausible?  Unfortunately, as part of Statistics New Zealand’s ongoing endeavour to deliver a better web experience they are doing maintenance on their servers today, so the quality of my sources may not be up to standard. Still, the University of Auckland career planning site says that retail employs about 265 000 people in NZ.  If half the theft is by staff, that’s about $1900 average per year — and if, say, as many as 75% of them are honest, that would be about $7500 for the others, which seems a bit high.

The other half of the billion dollars, attributed to shoplifting rather than staff theft, would be an average of  $2000/year if spread over  5% of the population, which also seems a bit high.  Maybe I’m just naive and innocent about this, but the worst incident quoted in the story was $20000 by four people; $5000 each, and the next worst was $1100 dollars —  you’d think there would be better examples.

The same University of Auckland page says gross revenue in retail is $65 billion/year, so $1billion would be 1.5% of that. The Retail Association has a report (p15) saying that net margins are about 2-3% averaged over the industry, so if the $1 billion were real costs, it would mean the industry is losing more than a third of its profits to theft. You’d think that would be the headline, if it were true.

May 10, 2013

Good information design

The NZ stock exchange front page:

mrp

They know what their visitors are looking for, and they make it easy to find. (via @lyndonhood)


Briefly

  • Forbes has a profile of a soon-to-be billionaire statistician, Dennis Gillings.  He basically invented the commercial clinical research model, and his company, Quintiles, is going public. 
  • The New York Times has a story about data(!) and science(!) being used to modify Hollywood scripts.  As Matt Yglesias points out, the studios can’t really take it that seriously or they’d be paying more than $20 000 for the service
  • Some Big Data backlash, from Quartz. Most data isn’t big, most data isn’t very good quality, and most businesses are in more need of expertise on data analysis than on large-scale computing.
May 9, 2013

Counting signatures

A comment on the previous post about the asset-sales petition asked how the counting was done: the press release says

Upon receiving the petition the Office of the Clerk undertook a counting and sampling process. Once the signatures had been counted, a sample of signatures was taken using a methodology provided by the Government Statistician.

It’s a good question and I’d already thought of writing about it, so the commenter is getting a temporary reprieve from banishment for not providing a full name.  I don’t know for certain, and the details don’t seem to have been published, which is a pity — they would be interesting and educationally useful, and there doesn’t seem to be any need for confidentiality.

While I can’t be certain, I think it’s very likely that the Government Statistician provided the estimation methodology from Statistics New Zealand Working Paper No 10-04, which reviews and extends earlier research on petition counting.

There are several issues that need to be considered

  • removing signatures that don’t come with the required information
  • estimating the number of eligible vs ineligible signatures
  • estimating the number of duplicates
  • estimating the margin of error in the estimate
  • deciding what level of uncertainty is acceptable

The signatures without the required information are removed completely; that’s not based on sampling.  Estimating eligible vs ineligible signatures is fairly easy by checking a sufficiently-large random sample — in fact, they use a systematic sample, taking names at regular intervals through the petition list, which tends to give more precise results and to be more auditable.  

Estimating unique signatures is  tricky, because if you halve your sample size, you expect to see 1/4 as many duplicates, 1/8 as many triplicates, and so on. The key part of the working paper shows how to scale up the the sample data on eligible, ineligible, and duplicate, triplicate, etc, signatures to get the unique unbiased estimator of the number of valid signatures and its variance.

Once the level of uncertainty is specified, the formulas tell you what sample size to verify and what to do with the results.  I don’t know how the sample size is chosen, but it wouldn’t take a very large sample to get the uncertainty down to a few thousand, which would be good enough.   In fact, since the methodology is public and the parties have access to the electoral roll in electronic form, it’s a bit surprising that the petition organisers didn’t run a quick check themselves before submitting it.