Posts written by Thomas Lumley (2645)

avatar

Thomas Lumley (@tslumley) is Professor of Biostatistics at the University of Auckland. His research interests include semiparametric models, survey sampling, statistical computing, foundations of statistics, and whatever methodological problems his medical collaborators come up with. He also blogs at Biased and Inefficient

July 6, 2012

Where does it all go?

In yesterday’s Herald story about alcohol consumption the superficial flaws hid a much more important inaccuracy.

The survey says:

“Of the 113,345,000 glasses of alcohol consumed in New Zealand between February last year and January this year, 28 per cent were drunk by men older than 50,”

Now, Stats New Zealand reports alcohol sales each year, and they say we bought 300 million litres of beer, 100 million litres of wine, and 70 million litres of spirits last year, totalling 33 million litres of pure alcohol.  To make the numbers add up, there would need to be about 290ml of pure alcohol (over 24 standard drinks) in each glass. At most two standard drinks per glass might be realistic as an average, so that’s off by a factor of more than 10  (in a statistic given to six significant figures).

Some of the alcohol would have been consumed by people under 18, who weren’t in the survey, but if they drink 90% of the alcohol sold in NZ we aren’t panicking nearly enough.  Some of it would have been sold to foreigners, and some discarded, but again there’s no way that adds up to 90%.

In fact, the number is implausible on its face: there’s 4.5 million people in NZ, and there must be at least 3 million over 18. That would give an average of only three drinks per month for adult Kiwis.

Even other survey data doesn’t agree. As I pointed out last week, the NZ  Alcohol and Drug Use Survey finds 26% of the adult population drinks more than twice per week. Just those people must rack up more than 113 million glasses per year.

Either someone has lost a decimal place somewhere, or survey respondents lie to Roy Morgan even more than they lie to government researchers.
July 5, 2012

Denominators yet again

Tony Cooper, in a Stat of the Week nomination, point us to the Herald’s headline

“Men over 50 nation’s biggest drinkers”

When you look at the body of the text, though, the data only say that men over 50, in aggregate, drank more than the other subgroups of the population.  That’s somewhat relevant if you are planning a sales campaign, in which case the Roy Morgan report might be useful.  It doesn’t tell you which group are the biggest drinkers, because that depends on per-person alcohol consumption.

As two of the experts actually quoted in the story said, men over 50 accounted for the largest chunk of the booze because there are a lot of men over 50, not because they are the heaviest drinkers.  A little simple arithmetic shows that, per person, men over 50 drank less than men 35-50, and less than men 25-34.  Not doing the arithmetic is one thing, but it really doesn’t look good when the headline also directly contradicts what your sources are quoted as telling you.

Counting deaths from power outages

The last big power blackout in the US, before this week’s one, was in 2003 in New York.  There’s a new paper out that estimates how many deaths it caused, and discussion at Simply Statistics.

At the time, the official report was 6 deaths, mostly due to carbon monoxide poisoning.  However, the number of deaths from all causes was 28% higher than usual, which implies an extra 90 deaths (obviously, with some uncertainty).

We don’t know which of the deaths during that period were caused by the power outage, but these “statistical deaths” were just as much real people as the 6 whose deaths were officially recognised.

The genome is big. Really big.

And to prove it, Yonder Biology is streaming the genome over the course of a year.  As you may remember from earlier posts, there are about 30 million seconds in a year, and 3 billion bases in the genome, so that comes to 100 bases per second for the entire year. (via)

July 4, 2012

Physicists using statistics

Traditionally, physics was one of the disciplines whose attitude was “If you need statistics, you should have designed a better experiment”.  If you look at the CERN webcast about the Higgs Boson, though, you see that it’s full of statistics: improved multivariate signal processing, boosted decision trees, random variations in the background, etc, etc.

Increasingly, physicists have found, like molecular biologists before them, and physicians before that, that sometimes you can’t afford to do a better experiment. When your experiment costs billions of dollars, you really have to extract the maximum possible information from your data.

As you have probably heard by now, CERN is reporting that they have basically found the Higgs boson: the excess production of certain sets of particles deviates from a non-Higgs model by 5 times the statistical uncertainty: 5σ.  Unfortunately, a few other sets of particles don’t quite match, so combining all the data they have 4.9σ, just below their preferred threshold.

So what does that mean?  Any decision procedure requires some threshold for making a decision.  For drug approval in the US, you need two trials that each show the drug is more effective than placebo by twice the statistical uncertainty: ie, two replications of 2σ, which works out to be a combined exceedance by 2.8 times the statistical uncertainty: 2.8σ.  This threshold is based on a tradeoff between the risk of missing a treatment that could be useful and the risk of approving a useless drug.  In the context of drug development this works well — drugs get withdrawn from the market for safety, or because the effect on a biological marker doesn’t translate into an effect on actual health, but it’s very unusual for a drug to be approved when it just doesn’t work.

In the case of particle physics, false positives could influence research for many years, so once you’ve gone to the expense of building the Large Hadron Collider, you might as well be really sure of the results.  Particle physics uses a 5σ threshold, which means that in the absence of any signal they have only a 1 in 30 million chance per analysis of deciding they have found a Higgs boson.    Despite what some of the media says, that’s not quite the same as a 1 in 30 million chance of being wrong: if nature hasn’t provided us with  a 125GeV Higgs Boson, an analysis that finds the result has a 100% chance of being wrong, if there is one, it has a 0% chance of being wrong.


Sincerest form of flattery

Thanks to the Google, while tracking down a specific phrase from a StatsChat post I found another site with a remarkably similar dialogue.  The main change is that the participants have been given names, implying a previously unreported interest in 21st century New Zealand accident statistics by the famous Russian probabilist Andrey Markov (who died in 1922).

[if the site goes offline, I have a screenshot]

Lazy scientific fraud

If you toss a coin 20 times, you will get 10 heads on average.  But if someone claims to have done this experiment 190 times and got exactly 10 heads of out 20 every single time they are either lying or a professional magician.

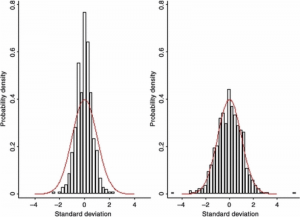
An anaesthesiology researcher, Yoshitaka Fujii, has the new record for number of papers retracted in scientific journals: 172 and counting. The fakery was uncovered by an analysis of the results of all his published randomized trials, showing that they had an unbelievably good agreement between the treatment and control groups, far better than was consistent with random chance.  For example, here’s the graph of differences in average age between treatment and control groups for Fujii’s trials (on the left) and other people’s trials (on the right), with the red curve indicating the minimum possible variation due only to chance.

The problem was pointed out more than ten years ago, in a letter to one of the journals involved, entitled “Reported data on granisetron and postoperative nausea and vomiting by Fujii et al. are incredibly nice!”  Nothing happened.  Perhaps a follow-up letter should have been titled “When we say ‘incredibly nice’, we mean ‘made-up’, and you need to look into it”.

Last year, Toho University, Fujii’s employer, did an investigation that found eight of the trials had not been approved by an ethics committee (because they hadn’t, you know, actually happened). They didn’t comment on whether the results were reliable.

Finally, the journals got together and gave the universities a deadline to come up with evidence that the trials existed, were approved by an ethics committee, and were reported correctly.  Any papers without this evidence would be retracted.

Statistical analysis to reveal fraud is actually fairly uncommon.  It requires lots of data, and lazy or incompetent fraud: if Prof Fujii had made up individual patient data using random number generators and then analysed it, there would have been no evidence of fraud in the results.   It’s more common  to see misconduct revealed by re-use or photoshopping of images, by failure to get ethics committee approvals, or by whistleblowers.  In some cases where the results are potentially very important, the fraud gets revealed by attempts to replicate the work.

July 3, 2012

Minimum pricing for alcohol

John Key is quoted in the Herald as not understanding minimum unit pricing

Mr Key believed that if a minimum price were set, it would change the quality of alcohol that people drank, but not the amount.

“What typically happens is people move down the quality curve and still get access to alcohol.”

The point of minimum unit pricing, as opposed to increased excise rates, is precisely to stop this.  The idea is that there is a minimum retail price for a quantity of alcohol: the proposal here was $1.50 per standard drink, in the law recently passed in Scotland it is 50p, and in the Canadian province of Saskatchewan it is $2.25.  If the price of your currently-preferred adult beverage is raised by the law, everything ‘down the quality curve’ will also have its price raised to exactly the same level.

There are reasons why it might not work: the price elasticity of demand might be low or there might be too much black-market supply. Reasonable people could also believe the benefits aren’t worth the impact on moderate drinkers: eg, at $1.50 per 12g of alcohol most red wines (at 14% alcohol) would have to cost at least $13.50 per bottle.  But, if anything, it would move people up the quality curve, not down.  That’s why it’s different from just raising excise rates.

You can read an analysis of the impact of the Saskatchewan policy, presented to the Scottish Parliament by a Canadian researcher: it seems to have reduced the quantity of alcohol drunk and also led people to drink lower-alcohol beverages.


Finding out if policies work

The UK Cabinet Office (with the help of Ben Goldacre and David Torgerson) has come out in favour of finding out whether new policies actually work:

Test, Learn, Adapt‘ is a paper which the Behavioural Insights Team is publishing in collaboration with Ben Goldacre, author of Bad Science, and David Torgerson, Director of the University of York Trials Unit. The paper argues that Randomised Controlled Trials (RCTs), which are now widely used in medicine, international development, and internet-based businesses, should be used much more extensively in public policy.

As we have pointed out before, lots of people come up with potentially good ideas for dietary interventions, crime prevention, reductions in drug use, and improved education, to name just a few targets.     The experience from medical research is that plausible, theoretically-sound, carefully thought-out treatment ideas mostly don’t work.  In other fields we don’t know because we haven’t looked.

June 30, 2012

Drug statistics

As you will have heard, the UN says that Kiwis smoke more pot than anyone else.  The figure quoted, eg, by the Herald is 9.1%-14.6% (they don’t say what the range means).  It’s useful to look at the actual survey data, the NZ Alcohol and Drug Use survey, which is conveniently available online.

The proportion of New Zealanders who used cannabis at least weekly in the past year is about 5.6%, and the proportion who used it more than 1-2 times/week is 3.8%.  For tobacco, the corresponding figure for more than 1-2 times per week is about 20% and for alcohol, 26%.

You can find statistics broken down by age, sex, ethnicity, frequency of use, and indicators of dependency (yes, people do get addicted to cannabis, just like to other drugs).