Posts written by Thomas Lumley (2645)

avatar

Thomas Lumley (@tslumley) is Professor of Biostatistics at the University of Auckland. His research interests include semiparametric models, survey sampling, statistical computing, foundations of statistics, and whatever methodological problems his medical collaborators come up with. He also blogs at Biased and Inefficient

May 4, 2012

US drinking age and road deaths

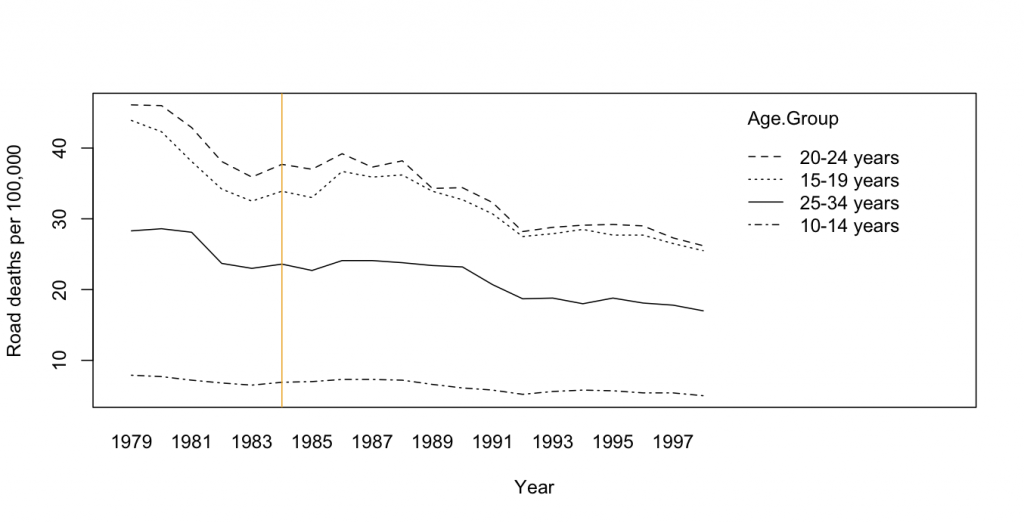
In an earlier post I looked at male youth suicide rates in the US before and after the drinking age was raised in July 1984, and said that expecting a decrease in road deaths made sense.  It does make sense, but it seems that it didn’t happen in the US.  The graph shows road deaths per 100,000 people by age group (from CDC), and there isn’t anything prominent that happens in 1984 or 1985.  The pattern is pretty much the same for ages 15-19, 20-24, and 25-34.  The younger two groups would have been affected by the law (with its supporters usually arguing that the youngest of the groups is the real target) and the oldest group would not have been affected.    You can think of all sorts of explanations for why a difference might not have been seen (for example, the US is bad at detecting and deterring drunk drivers), but the data has to be disappointing to people who want a change in the drinking age.


It’s interesting that there hasn’t been any real discussion in the NZ media of what happened when the US raised the drinking age.

May 3, 2012

Sheep research saves lives

The Herald has a story about premature birth rates across the world, which I will hijack to write about an important NZ scientific contribution, and a revolution in medical statistics.

One of the basic treatments for premature babies, which unfortunately is not available everywhere, is a simple $1 shot of corticosteroids.   This treatment was discovered accidentally by the great NZ medical researcher Graham Liggins.  Liggins was interested in what triggered preterm birth, and hypothesised that steroids were involved.  In experiments on sheep he didn’t find any effect on prematurity, but noticed huge differences in lung development in premature lambs given steroids.   A clinical trial in people found a dramatic reduction in deaths, but no-one really paid attention. After rejection from the Lancet, the trial results were published in another journal in 1972.

Over the following 20 years several additional trials were conducted, most of them too small to show a convincing effect. Finally  all the evidence was put together and obstetricians accepted that corticosteroids had an almost magical effect on lung development in premature babies.  The results of all the trials and the summary of their collective evidence forms the logo of the Cochrane Collaboration, an organisation dedicated to ensuring that randomized trial data doesn’t get lost, but ends up being incorporated in medical knowledge.


This September, the annual meeting of the Cochrane Collaboration is being held in Auckland, so if you see nerdy medical types roaming the streets, be nice to them. They can be useful.


Road deaths down

A record low in road deaths last month has been accompanied by an unusually good Herald story.   Andy Knackstedt from the Transport Agency is quoted as saying

“It’s too early to say what may or may not be responsible for the lower deaths over the course of one month.

“But we do know that over the long term, people are driving at speeds that are more appropriate to the conditions, that they’re looking to buy themselves and their families safer vehicles, that the engineers who design the roads are certainly making a big effort to make roads and roadsides more forgiving so if a crash does take place it doesn’t necessarily cost someone their life.”

That’s a good summary.  Luck certainly plays a role in the month-to-month variation, and these tend to be over-interpreted,  but the recent trends in road deaths are real — much stronger than could result from random variation.   We don’t know how much the state of the economy makes a difference, or more-careful driving following the rule changes, or many other possible explanations.

[Update: when I wrote this, I didn’t realise it was the top front-page story in the print edition, which  is definitely going beyond the limits of the data]

May 2, 2012

Survey respondents say the darndest things

Stuff is reporting a mind-boggling survey result

Nearly 15 per cent of people worldwide believe the world will end during their lifetime and 10 per cent think the Mayan calendar could signify it will happen in 2012, according to a new poll.

The obvious expectation is that this is a Bogus Poll and that nothing of the sort is true.  However, as the story says, this is a poll conducted for Reuters  by Ipsos, and the findings as given by Ipsos are just as Stuff reports them.

Presumably Ipsos, who know how to poll, are accurately reporting what people said, and the 15% and 10% figures are actually reasonably representative of what people will answer if you ask them that question.  That doesn’t mean the conclusions are true — they obviously aren’t true, since if 15% of people really believed that, they would be behaving differently.

This is a big problem with surveys — even representative polls of people can give weird results, because polls measure how people answer questions, not what they actually believe.

One of my favorite examples is a poll (via) conducted shortly after the massive  Gulf of Mexico oil spill, which found that  “28 percent of Republicans said the recent oil spill in the Gulf of Mexico made them more likely to support drilling off the coast“. This just makes no sense: you could rationally believe that the oil spill is just part of the costs of economic growth and that it doesn’t change your opinion, but supporting drilling more, because of a drilling accident that turned out to be worse and harder to fix than expected, is insane.


May 1, 2012

We can explain anything

If you have a research finding that is statistically borderline but makes sense biologically, it often seems that the biological explanation should make it more convincing.  Unfortunately, people are really good at explanations and almost any set of flimsy starting materials can be woven together into a superficially firm explanatory facade.  Keith Baggerley, who analyses gene expression data, says that the cancer researchers he works with can always find explanations for a list of genes that are overactive in a particular experiment — and he’s verified this by giving them completely random gene lists.

The Herald has a nice example in an article on functional foods:

You might be surprised to learn that you can often visually identify the function of natural foods. …Walnuts are nicknamed “brain food” and they look just like tiny brains complete with left and right hemispheres.

Sliced tomatoes resemble the structure of the heart with multiple chambers and, you guessed it, are credited with reducing the risk of heart disease. The list goes on – avocados for the uterus, celery for bones. It seems functional foods have always existed if you look closely.

It helps if you are allowed to stretch both the conditions for similarity and for functionality — celery isn’t distinctively good for bones, and the similarity of avocado to the uterus depends enormously on which variety you choose (or perhaps the Reed cultivar, in season now, and the seedless cocktail avocados are supposed to have other functions).     It also helps if you can ignore badly-fitting examples:  a Canadian paper recently had a similarly credulous story about mushrooms as a functional food, but edible mushrooms are of many different shapes, and the common cultivated mushroom shares its shape with things that you really don’t want to eat.

I won’t even comment on what organ the carrot’s shape shows it supposed to benefit.

April 30, 2012

Good gambling, bad gambling

The recent Sky City stories illustrate an interesting division in media reports of gambling


Drinking age and suicide?

The Herald says “Lower drinking age blamed for high rate of youth deaths” and quotes a University of Auckland researcher, Dr Anne Beautrais,

“Addressing alcohol use and binge drinking in young people in New Zealand is one of the most obvious avenues to reducing both suicide and traffic mortality.”

Dr Beautrais points out that the high suicide rate in NZ can’t just be attributed to better reporting than in other countries. The overall youth death rate is high in NZ, and while diagnosis of suicide might be variable, diagnosis of death is pretty reliable.   That all makes sense.   Road deaths are an important component, and there you’d expect lowering the drinking age to have some effect.

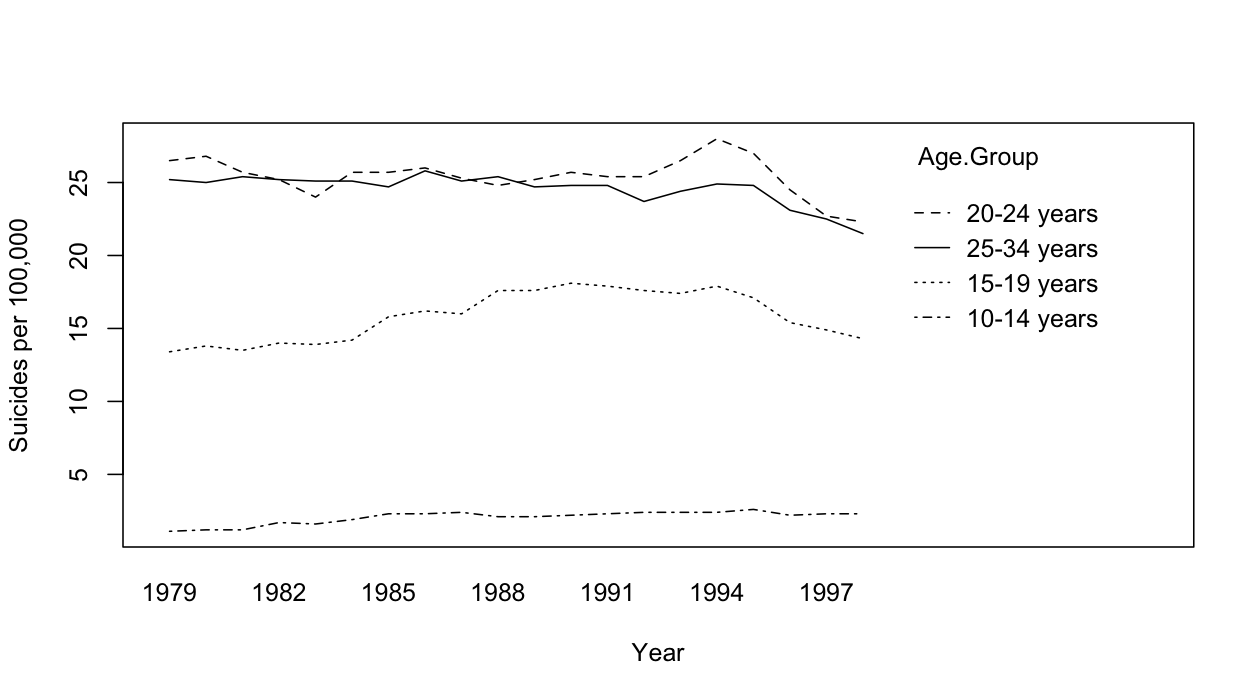
I’m less convinced by the drinking-age argument  for suicide.  One reason is the US experience, where the Reagan administration raised the drinking age to 21 in 1984.  The graph below (data from CDC) shows US male suicide rates by age group across time, and there’s really no sign of a decrease in 1984

April 28, 2012

Malignant iPhones?

The Herald has a headline “Scientists call for urgency on cancer-phone link”.  The actual content is ok, but the story does give the impression that it’s scientific consensus vs evil cellphone companies, which is not remotely true.  There’s a more balanced story in the Daily Mail (and that’s not a sentence you want to find yourself writing too often).

The facts:  there has been an increase in frontal lobe and temporal lobe brain tumours in the UK over the past decade, though not in total brain tumours.   If you lump together the two regions of the brain with increases and exclude all the ones with  decreases, you get about a 50% increase in rates, which comes to a bit less than one extra case per 100,000 people per year.   For context, that’s a bit less than the estimates of numbers of deaths due to phone use while driving.    There was a Danish study last year that did not find any differences between cell phone users and non-users, or differences in side of the head for users, but that doesn’t quite contradict the British results, for two reasons.  Firstly, there’s quite a bit of uncertainty in both sets of estimates, and they are just about compatible with, say, a 25% increase.  Secondly, the Danish study was mostly of non-malignant tumours, which are the most common ones, and the British statistics are for malignant tumours, so it’s possible the effect could be different, though there’s no known reason that it should be.

The increase could be chance (it’s statistically significant, but still), or an increase in diagnosis, or be due to something else entirely.  Or it could, perhaps, be due to cellphones.  In order to be confident it is cellphones we’d need much better evidence, especially as there isn’t really a convincing story yet of how cellphones could promote tumour growth.

The obvious textbook example of time trends revealing a cancer cause is smoking and lung cancer: smoking took off during World War I and lung cancer rates followed. Except that really isn’t the story.  When Richard Doll and Austin Bradford Hill set out to do their pioneering case-control study of lung cancer in London they were both smokers.  They were expecting the increases in lung cancer to be something to do with the dramatic increase in cars and bitumen roads — perhaps car exhaust, or perhaps some of the pollutants that evaporate off as roads are laid.  The real explanation was enough of a surprise that they were planning to extend the study to four additional cities as confirmation before publishing (until confirmation came instead from a parallel US study).   In that case the relative risk was 20 rather than 1.5, and the absolute lifetime risk increase was about 15% rather than about 0.05%, so it was a lot easier (and much more important) to find the real cause.

 The anti-cellphone scientists argue that it’s worth taking steps to reduce cellphone exposure even though the evidence is pretty weak, and they have a point.  The main step they propose is using a headset, preferably wired.  Lots of people are already doing that — if your phone is also your music player,  then headphones are an obvious necessity even if they don’t provide any protection from brain cancer.

 

April 22, 2012

Soon they’ll be blogging

According to the Herald, “Baboons learn to tell real words from gibberish”, which would put them ahead of some politicians and academics.   The story describes

… new research that shows baboons are able to pick up the first step in reading – identifying recurring patterns and determining which four-letter combinations are words and which are gobbledygook.

Here’s the press release,  and the scientific paper. After being trained with a bunch of real and made-up words with four letters (no, not the ones you’re thinking of), the baboons could classify new four-letter combinations with about 75% accuracy, compared to 50% for pure chance.

The scientists were a bit more restrained, saying that the baboons were probably looking at which two-letter pairs appeared more frequently in the real words.   In fact, as Mark Liberman describes at Language Log, it was probably even simpler than that.    If the baboons just recognised the shapes of  individual letters, that would be enough for them to get 75% accuracy.  If they were really doing anything more sophisticated they should be doing much, much better than 75% accuracy.

One thing I don’t understand, though, is why French psychologists would try to teach the baboons to recognise English words.

April 20, 2012

It might be a bit more complicated than that

The Herald has a very good story about a breast-cancer genomics project, where researchers looked at mutations in 2000 stored breast-cancer tumour samples, and used these to pigeonhole the tumours into 10 groups.  The hope is that this information can be used, eventually, to work out which tumours respond to which treatments, resulting in more effective treatment with fewer side-effects.

The researchers are properly careful about the implications

“I want to be very cautious here. This is a very important first step, and now what follows is to validate its clinical use,” Caldas said.

 In particular, there have been at least two papers recently that perform whole-genome sequencing on multiple samples from the same tumour (via “In the Pipeline”).  These researchers found surprising levels of heterogeneity within single tumours — different regions appeared to have developed different sequences of mutations more-or-less independently. Cancer seems to get more complicated whenever we look closer.