Posts written by Thomas Lumley (2645)

avatar

Thomas Lumley (@tslumley) is Professor of Biostatistics at the University of Auckland. His research interests include semiparametric models, survey sampling, statistical computing, foundations of statistics, and whatever methodological problems his medical collaborators come up with. He also blogs at Biased and Inefficient

April 19, 2012

Having cancer for longer

The Dominion Post says “More Kiwis are winning the battle with cancer, with fewer people dying once they are diagnosed.”  Obviously that’s not literally true: the number of deaths per customer is pretty convincingly fixed at one.  What they seem to mean is that people with cancer are surviving longer. This might be true, but the underlying research, unfortunately, doesn’t really show it.

The Otago researchers studied survival time from diagnosis, and showed that it is increasing for many cancers.  That is, Kiwis are spending more time having cancer than they used to.   Survival from diagnosis involves two points.  Moving the time of death later will increase survival, and is a Good Thing, but moving the time of diagnosis earlier without changing the time of death will also increase survival, and doesn’t do anyone much good.

What’s actually happening will be different for different cancers. For example, in breast cancer we know from randomized trials that both phenomena are occuring.  Mammography makes diagnosis happen earlier for everyone, and this results in postponing death for many women.

For solid evidence of improved survival in cancer, you really need to look at something like mortality rates per 100,000 population per year, where there isn’t a problem of moving the goalposts.

April 18, 2012

Lost in transcription

It’s often hard to tell who is responsible for a bad statistics story: did the journalist mess up it, or was it already broken? The  Herald’s story “Shoe therapy has real benefits – study” is an exception. It’s the paper’s fault.

If you go to the University of Canterbury home page, there’s a link to their press release about Jessica Boyce’s research.  Ms Boyce has found

  • Women who feel more insecure after exposure to media body ideals own more attractiveness-conferring accessories such as shoes and handbags, but not trousers
  • Women who are, in general, insecure, own fewer accessories

where ‘women’ means female students at UoC or University of Alberta.   She interprets the first finding to mean that buying accessories is a response to the media images, since the second finding means it isn’t simple reverse causation.  The Herald reports the first of these points, but not the second, which unfortunately makes the interpretation look completely silly, rather than perfectly plausible, though not compelling.

I’m a bit confused as to why UoC is promoting the story  now.  There isn’t any mention made of a publication or conference presentation, and she  still ‘hopes to finish her thesis by the end of the year’, so that’s not the trigger.

Counting domestic violence

Stuff is reporting on the police decision not to release domestic violence statistics this year, because they are in the middle of a change to a new system.

The police point of view seems sensible here: the only urgent use for the statistics would be to look at short-term trends, and this is meaningless if the definitions are changing.   The real question is whether the change in definitions is an improvement or not.

Domestic violence statistics are more complicated than many crime statistics because the legal system tends to organize statistics by which crime was committed.  Domestic violence isn’t a single crime — it’s a subset of a range of crimes — so it can’t be worked out retrospectively from other crime statistics, and it doesn’t have a unique legal definition.  The police say that they current change is to adopt a more similar definition to Australia.

All one family

From the Herald

It is one of the most improbable family connections. One is an actor famed as a languid Lothario. The other was one of the world’s most brutal but brilliant military leaders. Nevertheless geneticists say their analysis shows Tom Conti is indeed directly related to Napoleon Bonaparte.

For this to be true you need to stretch the usual meaning of “directly related” a little. More than a little.  In fact, using that definition, pretty much everyone in the world is probably related to Napoleon, so you also need to stretch the usual meaning of “improbable”.

What the story actually says is that Tom Conti and Napoleon have the same Y-chromosome haplogroup.  That is, they have a common great-great-…-great-grandfather in the very distant past, and so share a small chunk of DNA.   The Y chromosome is special only because it’s easier to track ancestors; Tom Conti will also share small chunks of DNA on other chromosomes with many other people, based on a common ancestor that wasn’t solely in the male line.

In our genetic research, we measure millions of common genetic variants on large numbers of people. Every one of those variants started off as a mutation in a single person, who is an ancestor of all the people who now carry the variant. For the variants we are interested in, this is at least 1% of all people with European ancestry.   These people are all related, in the Conti-Napoleon sense. And that’s just looking at one genetic variant out of millions.

When you go back as few as 30 generations, you have a billion ancestors, which is more than the number of people alive at that time. There has to be a lot of overlap and double-counting and it’s not at all surprising if there is overlap between your billion ancestors and Napoleon’s.  Or Winston Peters’s


April 16, 2012

Slightly dodgy drug stats, episode n+1

In February, Stuff had a story about the 519 people who had a roadside drug impairment test since the changes to the law in November 2009, 429 of whom failed and showed up as having taken drugs.  This time it’s the Herald, with 568 drivers from November 2009 through this February.

Those numbers, presumably, are correct, though they don’t actually mean all that much.  The numbers were highest in the Bay of Plenty region, but that was because of more police effort and doesn’t necessarily indicate more impaired driving in that region.

An ESR study of blood samples from accidents gets quoted, as usual, this time by an AA spokesman and without any provenance

He noted a recent study that found of 1046 drivers who died in crashes between 2004 and 2009, about 35 per cent had cannabis or other drugs in their system, either on their own or in combination with alcohol.

As we pointed out last time this study came up, that’s not the same as impairment:

The ESR report defined someone as impaired by alcohol if they had blood alcohol greater than 0.03%, and said they tested positive for other drugs if the other drugs were detectable.   If you look at the report in more detail, although 351/1046 drivers had detectable alcohol in their blood, only 191/1046 had more than 0.08%.  At 0.03% blood alcohol concentration there may well be some impairment of driving, and near 0.08% there’s quite a lot, but we can’t attribute all those crashes to alcohol impairment rather than inexperience, fatigue, bad luck, or stupidity.  At least the blood alcohol concentrations are directly relevant to impairment.  An assay for other drugs can be positive long after the actual effect wears off. For example, a single use of cannabis will show up in a blood test for 2-3 days, and regular use for up to a week.  In  fact, the summary of the ESR report specifically warns “Furthermore, it is important to acknowledge that the presence of drugs and alcohol in the study samples does not necessarily infer significant impairment.”  Regular pot smokers who are scrupulously careful not to drive while high would still show up as affected by drugs in the ESR report


April 15, 2012

Multitasking helps with multitasking

Study reveals modern multi-tasking is good for your brain” says the Herald. This time they don’t say where they found the study, though we do get told the researchers’ names and institution, so perhaps a B- on provenance.

Multi-tasking in this day and age can leave you in a bit of a tizz.

Juggling too much technology at once – such as texting or browsing online while watching TV – is said to make you less efficient.

But Chinese researchers have found that multi-tasking 21st-century style can be good for the brain.

What they actually found was that multitasking made you better at a specific multitasking-type computer test, which    is interesting, but isn’t at all relevant to whether ‘Juggling too much technology at once’ makes you less efficient.

Connoisseurs of the tabloid science style will not be surprised to find that the story came via The Daily Mail. A better source is the journal’s press release, which also links to the journal article.

Sleep, and his brother

The Herald has a very good story on sleeping pils and increased rates of death.  The story describes the study design and the findings, names the journal, and even gives a link to the paper, which is  in an open-access journal.

The study itself is interesting: they looked at at 10,000 people who took sleeping pills, and about 23,000 who didn’t, from a large US healthcare system (about the 2/3 the size of New Zealand).  After matching as well as they could on other health factors, the researchers still found a much higher rate of death, 3-5 times higher, in people who took sleeping pills.

It’s not easy to think of a sufficiently-strong confounding effect to explain this — you would need a factor that increases people’s chance of taking sleeping pills at least 3-5 times and also increases their rate of death at least that much. One possibility is sleep disturbance itself — it could be that needing sleeping pills is the risk factor, and the pills themselves are relatively innocent.

One factor that, I think, does cast a bit of doubt on the results is that the associations were about the same for all classes of sleeping pills:  the traditional benzodiazepines, the new short-acting drugs such as Ambien, and sedating antihistamines.   It’s entirely plausible that they all have adverse effects, but it’s a bit surprising that the effects would be so similar.

April 13, 2012

A new StatsChat bogus poll


What’s wrong with this picture?

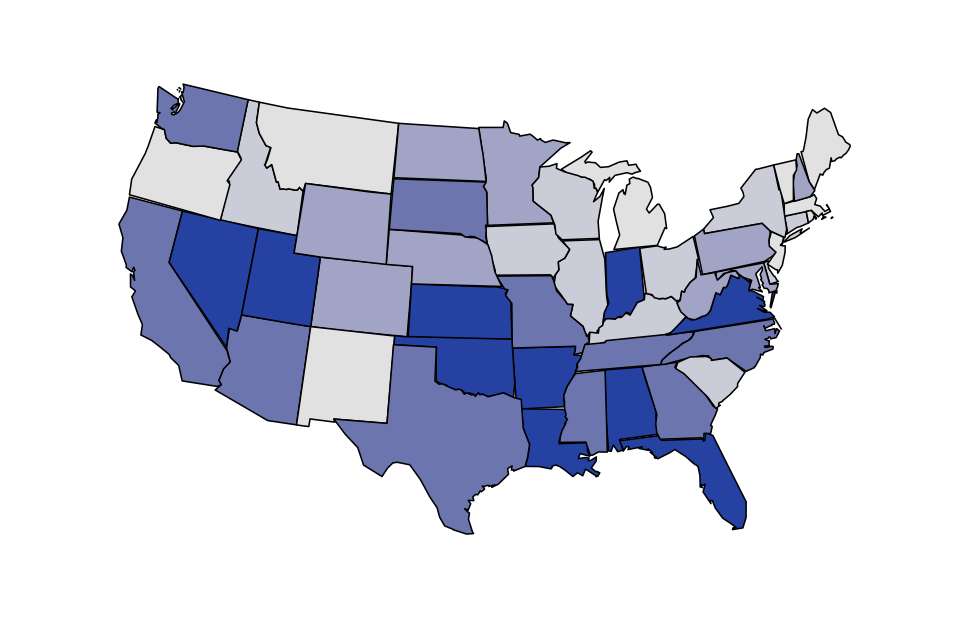
It’s not just the NZ media that has problems with denominators.  This graph from the Washington Post shows where US Federal health reform money is being spent.  And, surprise, surprise, there’s more money being spent in states with large populations.

The map is actually from the Kaiser Family Foundation, and they even have a cute interactive version that lets you look at different subcategories of funding.  What they don’t let you do is standardize by any useful denominator: population, health care expenditure,…   They do let you look at the map both in dollars and in fraction of the total, but, not surprisingly, it looks exactly the same on both scales.

Fortunately it isn’t hard to find the populations of US states, and R lets us draw pretty maps.  Below is the same map coloured according to per-capita Federal health reform funding, which looks almost completely different.

The facts speak for themselves?

Two headlines based on the same data from QV.  In the Herald

Auckland house values soar

and in Stuff

House prices ease in March

And it’s not just the sub-editor’s fault; the headlines match the text of the story in both cases.