Posts written by Thomas Lumley (2645)

avatar

Thomas Lumley (@tslumley) is Professor of Biostatistics at the University of Auckland. His research interests include semiparametric models, survey sampling, statistical computing, foundations of statistics, and whatever methodological problems his medical collaborators come up with. He also blogs at Biased and Inefficient

February 25, 2012

It’s not diet ideas we’re short of

You will have noticed the Herald’s ‘Fat list’ of foods yesterday.  University of Otago researchers have come up with another idea for helping people lose weight; a list of foods that are high in calories and low in other nutrients, which aren’t necessary and can be trimmed from your diet. It’s a plausible approach, and while you might have thought the items on the list were obvious, the Herald article makes it clear that they aren’t.

For example, Honey NZ manager Greig Duncan was quoted as saying that honey was “a healthier alternative, and had many other health benefits important for a balanced diet” and that “Because honey is such a natural product, it has a lot of bioactivity which is all part of a natural diet.”   At times like these it is important to remember the immortal words of Mandy Rice-Davies: “Well, he would say that, wouldn’t he?”

The only problem with the NEEDNT list is that we are given no evidence that it actually works as a health intervention.  That is, does handing out copies of this food list to people actually lead to weight loss? Does it work better than giving them a copy of the Atkins diet books, or the CSIRO Prudent Diet, or the South Beach diet?  Or making them take photos of all their food? Or sending them text messages about exercise?  Or any of the other thirteen bazillion weight loss strategies that have been published over the past half-century? This is exactly the sort of public health intervention that needs a randomized trial. It’s more work and less fun than coming up with creative weight-loss ideas, but it has the advantage of actually being useful.

In the mid-70s, the British comedy duet Flanders & Swann wrote a song about dietary fads, called “Food for Thought”.  It’s depressing how little it has dated.

The secret is, think white fish. You can gorge until it hurts.
But just one piece of shortcake and you’ll get your just desserts.


February 22, 2012

More precision than strictly necessary?

Statisticians like precise information, but the new ICD10-CM codes for illness and injury perhaps go too far.

Suppose you’re out tramping in Otago and you get bitten by a kea, which flies off and then comes back for a second go.   These are

  • External causes of morbidity (codes V00-Y99)
  • subcategory: Exposure to animate mechanical forces (codes W50-W64)
  • subcategory:  Contact with birds (W61)
  • subcategory: W61.0 Contact with parrot
  • subcategory: W61.01Bitten by parrot

and the two bites have different codes: W61.01XA (initial encounter), and W61.01XD (subsequent encounter).  If it was a kakariki instead, the codes would be under W61.21(Bitten by other psittacines), but having a magpie dive into your head would just be the more general W61.92 (Struck by other birds).

[via: Ezra Klein]

February 21, 2012

Avoidable errors

There were two stories on avoidable medical errors last night when I was watching the news.  The obvious one was on statistics from the District Health Boards on errors made in hospitals. These were up last year, though we don’t know whether it was better reporting or more errors.  On this topic, the best person to read is US surgeon Atul Gawande, especially his book The Checklist Manifesto.  As he points out, doctors do the wrong thing a lot more than they did a century ago, because there are so many more things they have to do right — medicine is getting more and more complicated.   It’s also helpful context to remember that avoidable errors in driving cause about 300 deaths and 6000 serious injuries per year in New Zealand.

The other story was on avoidable public health errors: the rate of infectious disease in New Zealand and its relationship to poverty and ethnicity. There are a lot of different diseases involved, but the most dramatic example is rheumatic fever.   Rheumatic fever is a nasty and almost completely preventable complication of  streptococcal throat infections, and in industrialized nations with modern healthcare systems it just shouldn’t be happening.   In the US, rheumatic fever is sufficiently obscure that it showed up in an episode of House, and even then it was just due to the patient not taking prescribed antibiotics properly.   There are major NZ initiatives to reduce rheumatic fever,  but this is the sort of medical statistic that should be in the news, because public awareness and public pressure on government is helpful in getting the problem fixed (rather than just getting it hidden, as is the risk with hospital errors).

February 19, 2012

Don’t drink and drive, smoke dope and fly.

Stuff is reporting on a new paper in the BMJ (or as Stuff calls it, only 24 years after the name change, the British Medical Journal) saying that smoking dope doubles your chance of  a serious or fatal car accident.  Regular readers of StatsChat posts on drug journalism will be pleasantly surprised to hear that this is actually what the research paper says, and that the researchers had moderately good evidence for this conclusion.

The paper compiled the results of previous studies, restricting their attention to studies that had a control group, and that measured  actual THC concentration in the blood, rather than the inactive metabolites that can be detected days later in blood or urine.   Some of the studies compared drivers in crashes to drivers not in crashes, others compared the driver responsible for the crash to other drivers involved in the crash.

The summary of the findings looking at various ways of breaking up the data is:

That’s a forest plot, with the dots showing the estimated risk ratio [technically odds ratio, but it doesn’t matter in this context] and the lines showing the 95% margin of uncertainty.   Though some of the lines include the null value 1.0 and others don’t, there’s pretty clear agreement across the analyses that cannabis increases crash risk, by a factor of two or so.

After getting it right so far, Stuff unfortunately went further and said “The research found cannabis significantly impaired the psychomotor response, or muscle activity linked to mental processes.”  That isn’t actually what they found. That’s in the Introduction section of the paper, because it’s telling us what was already known — dope makes you slower and clumsier.  The BMJ isn’t publishing research telling us that, any more than they publish conclusions on the spatial distribution of ursine excretory activities, or the religious affiliation of the Pope.

They finish up by saying “The Land Transport Amendment Act 2009 will be reviewed this year and police are investigating the possibility of introducing more effective roadside drug tests.” This paper doesn’t really lend much support to changes in current roadside drug tests, which have the advantage of testing for actual impairment and not being specific to a single drug.

Dog bites man

The NZ Herald is reporting that more people died in NZ last year than in any previous year. Since

  • the population is expanding
  • the average age of the population is increasing

we’d expect record numbers of deaths to be the rule rather than the exception.  And that’s what Statistics New Zealand shows us:


February 18, 2012

No magic bullet

There has been a lot of fuss recently in the West Island around a paper by Dr Alan Barclay on trends in sugar consumption and obesity.  When read as a reaction to a rather extreme US paper in the prominent journal Nature claiming ‘sugar is as toxic as alcohol‘ it is a reasonable piece of analysis, but it is being overinterpreted.

The New Zealand Science Media Centre (who are typically sensible and well-informed*) and their Australian counterparts have commentary on the ‘evil sugar’ paper from three experts, who agree that specific effects of sugar beyond its calorie content are not that strong, and, of course, that excess sugar consumption doesn’t directly hurt anyone but you: it doesn’t make you get into fights or crash cars.  On the other hand, there is the calorie content.

(more…)

February 17, 2012

The right music makes you younger.

Researchers asked 30 University of Pennsylvania undergraduate to listen to a randomly-assigned piece of music, and then to record their birth dates.

According to their birth dates, people were nearly a year-and-a-half younger
after listening to “When I’m Sixty-Four” (adjusted M = 20.1
years) rather than to “Kalimba” (adjusted M = 21.5 years),
F(1, 17) = 4.92, p = .040.

This is a randomized experiment, not just an observational study, so we can conclude that listening to the Beatles actually changes your date of birth.

The point of the paper was to show that various sorts of sloppy design and modestly dodgy reporting of statistical analyses, especially in small data sets, can lead to finding pretty much anything you want.  You can then issue a press release about it and end up in the newspapers.

Some fields of science already know about this problem and have at least attempted to introduce safeguards. Medical researchers and statisticians have put together reporting guidelines that the better medical journals insist on following. The  CONSORT guidelines for randomized trials are pretty widely accepted.  More recently, STROBE addresses observational studies, and  PRISMA (formerly QUOROM) covers systematic reviews.


February 16, 2012

It depends on what you ask

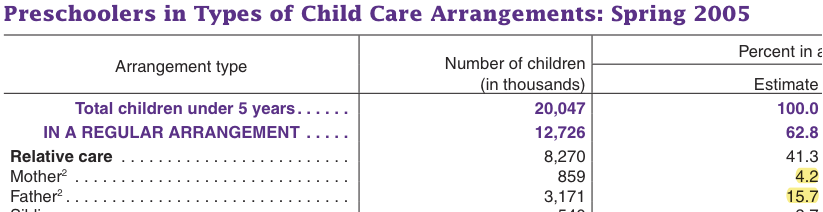
This table is from a US Census Bureau report  Who’s Minding the Kids? Child Care Arrangements:Spring 2005/Summer 2006.  The report in general is boring and informative, but Table 1 stands out: why are nearly four times as many pre-schoolers cared for by fathers vs mothers!?

It turns out that there is an explanation, but it shows how interpretation of statistical output depends on exactly what you ask.  The Survey of Income and Program Participation (SIPP) samples a ‘designated parent’ for each child, and if both mother and father are available they always choose the mother.  The child-care arrangement data are for child care by someone other than the designated parent, so ‘care by the mother’ means ‘care by the mother when the child lives with the father’.  As you would expect, some fathers don’t like this, and neither do some mothers, and it does seem a bit twentieth-century.

In partial defense of the Census Bureau, they have good reasons for being very reluctant to change their questions, because they are often interested in trends over time.  And Table 2 of the report does break down care arrangments by who the child lives with, and by employment information, and other factors.

February 13, 2012

Big Data in NY Times

 The trouble with seeking a meaningful needle in massive haystacks of data, says Trevor Hastie, a statistics professor at Stanford, is that “many bits of straw look like needles.”

Read more at New York Times.

Tip of the icecube

The Dominion-Post is reporting ‘hundreds of unfit teachers in class’.  They haven’t made any attempt to scale this by the number of teachers, or compare it to other professions, or basically anything that would make the number interpretable.

The number of teachers employed at State or State Integrated schools in NZ as at April 2011 was 52460. This misses out the non-integrated private schools, but they are a small fraction (4% of students).   With 664 complaints over two years, that is a rate of 1 complaint per 158 teachers per year.  About half the complaints are dismissed.

For comparison we need other professions where the public can make complaints to independent adjudicators.

  • As of June 2008 there were 8230 sworn members of the police force in NZ. In the most recent single year where data are available (2010/11), there were 2052 complaints to the Independent Police Conduct Authority, that is, 1 complaint per 4 police per year.  Half the complaints were Category 5, ie, minor, too late, or otherwise not worth proceeding with.
  • As of the last Census, there were 4284 people in NZ employed as reporters, editors, or sub-editors.  This probably overstates the number of journalists relevant to the Press Council, since it includes technical editors, book editors and so on.  The Press Council received 149 complaints in 2010, the last year for which they have published a report. In that year, 65 complaints went to adjudication (1 complaint per 66 journalists per year), and about half of these were upheld.

In all three professions roughly half the formal complaints that make it to the independent adjudicators are upheld and half are dismissed, but journalists are twice as likely as teachers to receive formal complaints, and police are about forty times more likely.

It’s quite likely that the headline is literally true: there probably are hundreds of unfit teachers, but that’s likely under 1% of all teachers.  It’s worth trying to weed them out, but not without considering the costs.  In any case, the amount of fainting and clutching of pearls the situations warrants is pretty limited.