Posts written by Thomas Lumley (2645)

avatar

Thomas Lumley (@tslumley) is Professor of Biostatistics at the University of Auckland. His research interests include semiparametric models, survey sampling, statistical computing, foundations of statistics, and whatever methodological problems his medical collaborators come up with. He also blogs at Biased and Inefficient

December 13, 2011

Below the margin of error

“a policy which recognises that individuals are the owners of their own lives, and which probably has the potential to win broad support at a time when they’re polling below the margin of error” – NZ Classic Liberal

“Radio Rhema, Inferno, Solid Gold, Radio Live, Sunday News,  and Herald On Sunday all rate below the margin of error” – Greater Queenstown/Arrowtown Media Survey

“Whether our party does well, or remains mired below the margin of error, there is little doubt that libertarian ideas are slowly diffusing into the public consciousness.” – Sean Fitzpatrick, Libertarianz

“Given that ACT was last polling below the margin of error, their opinions, flattering or otherwise, hardly seem likely to sway the result.” – The Northland Age.

“Look at Huntsman running below 2 percent. He is running below the margin of error. That’s how bad he’s doing. He may actually have zero or owe somebody votes.” – Dean Obeidallah

Dean Obeidallah is a professional comedian, and he knows it’s a joke.  The others seem to be serious, though they may just mean “very small” rather than anything more precise.

Careful pollers refer to the uncertainty margin they routinely quote as the “maximum margin of error”.  Unfortunately the first word gets left off by most people who quote the results.   The maximum margin of error in a poll is the margin of error in an estimate of 50%.   That’s fine for the major parties, but if you want to know how many people support Winston Peters, or how many believe they have been abducted by aliens, you need a different formula.
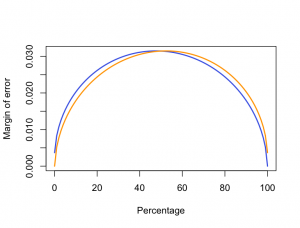
Since proportions can’t be negative, and since any non-zero percentage in a poll implies a non-zero percentage in the population, the uncertainty must be smaller for percentages near zero or one hundred.  The uncertainty range must also be asymmetric: a 1% result can’t overestimate the truth by more than 1%, but it could underestimate the truth by more than 1%.

The graph shows the upper (blue) and lower (orange) margins of error for percentages from 0 to 100% in a poll of 1000 people, the size that Colmar Brunton typically uses.  Over the range from about 20% to 80% the curve is pretty flat, and using the maximum margin of error is a good approximation.  For values less than 10% or more than 90% we need a better rule of thumb.

Some rough approximations that might be useful:

  • At 10%, the margin of error is about two-thirds of the maximum
  • At 5%, the crucial MMP threshold, the margin of error is about half the maximum
  • For percentages greater than zero but less than the maximum margin of error, the relative margin of error is roughly 50%
  • If the percentage is zero there isn’t any margin of error downwards, but the upper margin of error is 3 divided by the sample size (eg 3/1000=0.3% for a sample of 1000).

The first two of these rules of thumb come from the formula for the variance  of a proportion p, which is p(1-p)/n for a sample size of n. The maximum margin of error is the square root of 1/n, so we can work out n easily.

The last rule is the famous rule of three: if you see none of something, the upper bound for the proportion is the same as the estimate if you had seen three of them.

The third rule is a rough approximation based on looking at some numbers, and is less accurate than the others.
December 1, 2011

Lipitor Patent Day

Today (or, given time zones, yesterday) the best-selling drug of all time goes off patent in the USA.

Atorvastatin (Lipitor) became such a gigantic commercial success for two main reasons: it actually works slightly better than the earlier cholesterol-lowering drugs, and Pfizer funded several large clinical trials proving that it worked better.  Despite the (often justified) cynicism about drug marketing and approval, the regulatory process does mean that effective treatments are more profitable than ineffective ones — in sharp contrast to supplements and herbals, where effective treatments don’t have any real marketing advantage.

The patent expired earlier in New Zealand: in June 2010, Pharmac found a generic supplier and reduced the price for a month’s supply from $18 (for the lowest dose) to $1.77.   In the US, Lipitor costs more than US$3 per pill, so there’s even more room for price decreases.


November 30, 2011

Half of what?

The sesquipedalian accounting company PwC has a new business fraud report, claiming that half of all NZ businesses have been victims. This is from a survey with 93 Kiwi respondents, including some businesses with even fewer than 200 employees.

The obvious problem is that large businesses have many more employees and are much more likely to have at least one case of fraud.  Small businesses, of which there are many, are vastly under-represented.  A more dramatic example from a few months back was the claim by the US National Retail Federation that 10% of companies it polled had been victims of a ‘flash mob’ attack.   That’s not 10% of stores, that’s 10% of a sample of 106 companies including BP, Sears, and North Face.

The claim that fraud is on the rise could still be supported by the data, as long as the same methodology was used now as in the past, but the reported change from 42% to 49.5% would be well within the margin of error if the 2009 survey was the same size as the new one.

PwC’s Alex Tan explains the rise as “We’re a relatively low-wage economy but we like high-wage living.”  This certainly isn’t a result of the poll — they didn’t poll the perpetrators to ask why they did it — and it sounds rather like the classic fallacy of explaining a variable by a constant.   New Zealand is a relatively low wage country, but we were a relatively low wage country in 2009 as well, and even before that.  Baches are expensive now, but they were expensive in 2009, and even before that.   If low wages and expensive tastes are overcoming Kiwis’ moral fibre this year, how did they resist two years ago?

Averages and diversity

The NZ Herald has a headline “Little diversity in New Zealand’s average politician“.Of course there’s little diversity in an average — that’s what a one-number summary is for — but the article is mostly about representativeness.

The article says that the typical MP “was a straight European man, from the North Island, aged in his 50s”.  If we compare MPs to other people in full-time employment, we see that they are also most likely to be straight, European, male, and from the North Island, though younger than 50.

The interesting question is which groups are under-represented, and why.   MPs are substantially older than the rest of the employed population. Women are substantially under-represented. Maori are slightly over-represented relative to their population, which is by the design of the electoral system.  Pacific Islanders and Asians are under-represented, by a large enough margin that it’s not entirely due to some migrants only being residents, and so eligible to vote but not to stand for election. And at 95%, straight people are slightly under-represented.


November 24, 2011

Interactive map of US road deaths

Zoom in anywhere in the US and see the locations, with icons indicating year and who died.

They also have a UK map, and are interested in expanding to other countries where the data are available.

November 23, 2011

Voting method simulator

Since the election is rapidly approaching, it’s probably a good idea to repost the link to the voting simulator.  Created by Geoffrey Pritchard and Mark Wilson, this allows you to put in proportions of votes and estimate the likely makeup of Parliament under MMP and the four alternatives that are being proposed. There’s also some discussion and a Frequently Asked Questions list.


Visualising money

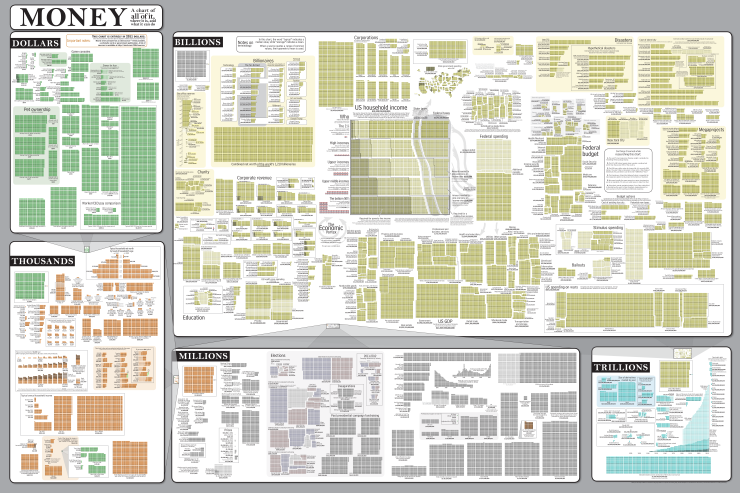
Randall Monroe, at XKCD, has produced another of his amazing charts (click for the full-size version).

Money: a chart of (almost) all of it, where it is, and what it can do.

What do statisticians do all day?

Well, for the past two days, we’ve been listening to our MSc and BSc(Hons) students presenting the results of their research projects.  Here’s a list of titles:

Applying Propensity Scores to Compare Hospital Performance

Order book modelling on the New York Stock Exchange

What Foods are Safe to Eat?

In a Genetic Haystack: Exploring Sparse Microarray Time-Series

Network Meta-Analysis: A Simulation Study and Update

Genome-wide Heterozygosity and Successful Aging in the Cardiovascular Health Study Cohort

Dynamic Advertising Modelling by Implementing Bayesian Forecasting

Occupation-based Socioeconomic Scores: A Path Analysis Approach

Dotcharts in R – What, Whoa and Why

Simulation and Estimation of Stochastic Differential Equations

In or Out? Examining Whether Macroeconomic Variables Help Predict the NZ/US Exchange Rate

Bayesian Estimation of Variance in the Binomial Option Pricing Model

The Introductory Statistics Course: Student Attitudes and Perceived Relevancy

Using Principal Components for the Evaluation Likelihood Ratios for Forensic Trace Evidence

Assessing Genetic Relatedness for Invasive Rats

Hospital Restructuring: was it Harming Us?

Reproducible Research – The Report with Nothing to Hide

Choosing a Transformation or Distance Measure in Ecology: What Do You Throw Away?

Multivariate Extension of ATRIMS Using Copulas with an Application to the Stochastic Volatility Model

A Comparison of Lenth’s Method and APC for the Analysis of Unreplicated Experiments

Constructing Confidence Regions for the Stationary Points of Second Order Response Surfaces

Stepped Wedge Randomised Controlled Trial Design: A Systematic Review and a Case Study

Discrete Choice Modelling with VGAM

Today, the department is running an all-day workshop for high-school teachers.

November 17, 2011

Blaming road deaths on mum

Over-protective mothers are now being blamed for road deaths among teenage boys.  I suppose it’s a change from saying that overprotective mothers make boys gay, as Freud famously imagined.

We’ve written before about the problem of seeing and trying to explain a trend when there’s really nothing there but random variation.  That isn’t what’s happening here.  In this case the trend is real. It’s just in the opposite direction to the explanation. (more…)

November 16, 2011

Goodhart’s Law and Argentinian hamburgers

Goodhart’s Law says Any observed statistical regularity will tend to collapse once pressure is placed upon it for control purposes.

The Big Mac Index has been used to compare prices across countries, as we have noted before.  Brazil Argentina currently has very high prices due to a combination of inflation and a strong economy, and this shows up glaringly in the Big Mac Index.

Tyler Cowen reports (translating a Spanish original) that the Brazilian Argentinian government has persuaded McDonalds to lower the price of the Big Mac (relative  to other McDonalds items, and relative to competing hamburgers), so that Brazil’s Big Mac Index becomes more competitive.


Updated: I actually do know that Argentina and Brazil are different countries, and that Brazil doesn’t speak Spanish.